Economic Update For The Week Ending April 5, 2014 with Syd Leibovitch

End Of The Year Numbers (3)The March Bureau of Labor Statistics jobs report was released Friday. It showed that the economy added 192,000 non farm jobs. This was welcome news after 3 months of much lower than expected gains, which were attributed to poor weather by many. January and February numbers were revised upward as well. The gains were all in the private sector, as government jobs showed no increase. The sectors with biggest job gains were: Professional and Business services, 57,000. Health care, 19,000. And Construction, 19,000. Construction has added 151,000 jobs over the last year. The March national unemployment rate held steady at 6.7%, the same rate it was at in February, however it did show that job creation is continuing at a steady pace. The labor force participation rate, or the proportion of working-age Americans who have a job or are looking for one rose to a six-month high of 63.2 % from 63%  in February. This signals more people looking for work that had taken themselves out of the work force, as they are more optimistic about finding jobs than in the past.

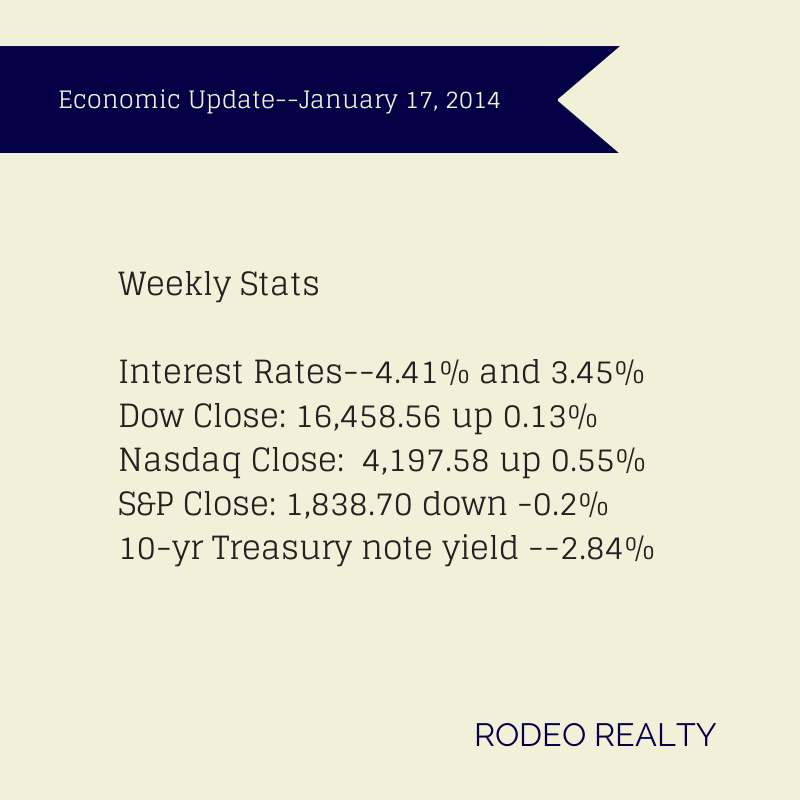
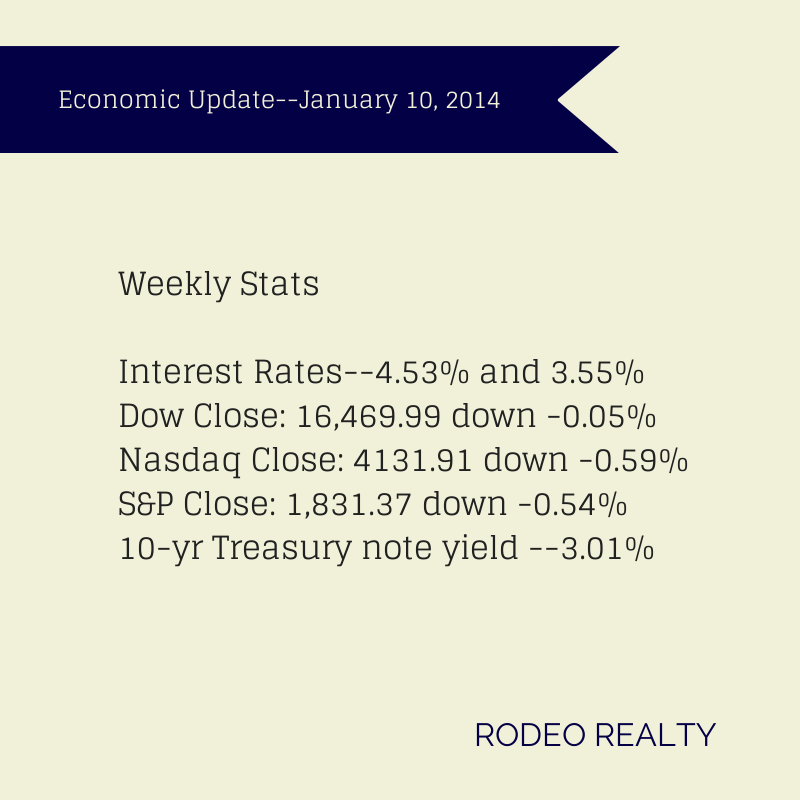
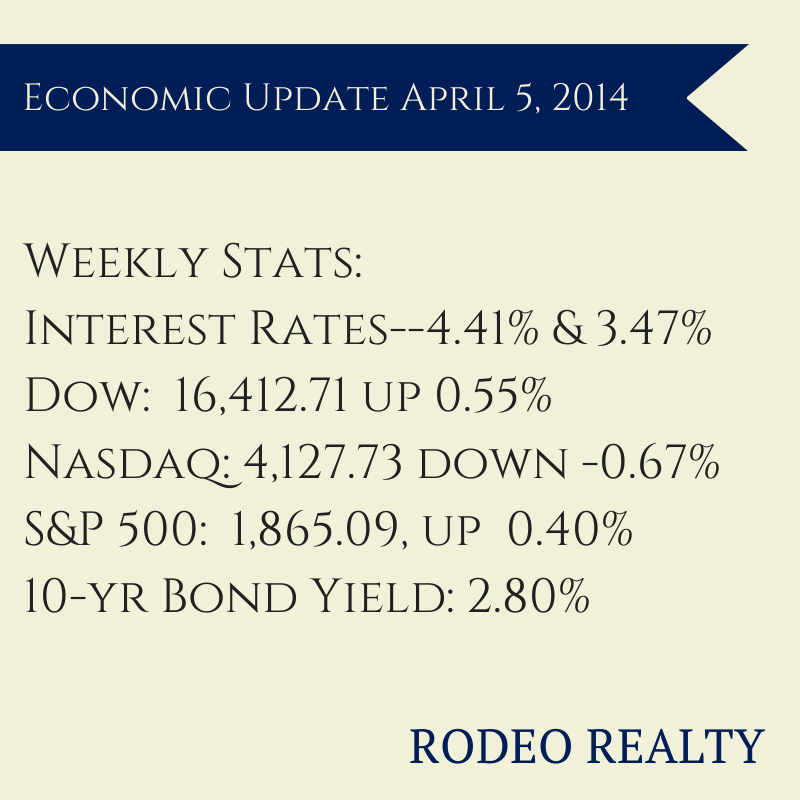
The Dow rose this week to 16,412.71 up 0.55% from last week’s close of 16,323.06. Earlier this week, the Dow closed out the month at 16,457.66 up 0.83% from last month’s close of 16,321.90. It fell -0.7% for the quarter.

The Nasdaq however continued to fall. It dropped to 4,127.73 down -0.67% from last week’s close of 4,155.76 led by a plunge in biotech and internet stocks. The Nasdaq has lost 20% on 300 key stocks since its high point in early March and is now in bear market territory.  The Nasdaq ended the month at 4,198.99 down  -2.53% from last month’s close of 4,308.12. It rose 0.5% for the quarter.

The S&P 500 also rose, boosted by the jobs numbers, ending the week at 1,865.09, up  0.40% from last week’s 1,857.62 close but off a record high of 1,890.90 hit Wednesday after an ADP report showed job growth and the Commerce Department reported that factory orders rose 1.6% in February. The S&P 500 ended the month at 1,872.34, up 0.69% from last month’s 1,859.45 close. It gained 1.3% in the first quarter of the year.

The 10 year treasury bond yield ended the week at 2.80%. It was 2.73% last Friday and 1.78% a year ago. This signals an upward trend for Mortgage interest rates which closely follow the treasury bond market. Rates actually fell in January have been very steady since. This was mostly due to the disappointing December and January job numbers. With February and March numbers back in line with expectations, expect rates to continue to rise as they have in the last week.

The Freddie Mac Weekly Primary Mortgage Market Survey showed that the 30-year-fixed rate rose  to 4.41%, the rate was 4.40% last week. The 15-year-fixed rose to 3.47% from last week’s 3.42%. They were more like 4.5% for 30 year and 3.5% for 15 year after the jobs report was digested yesterday.  A year ago the 30-year fixed was at 3.54% and the 15-year was at 2.74%. Loans over $417,000 are more like 4.75% for 30 year and 3.75% for 15 year fixed terms today.

U.S. construction spending showed a slight increase in February, up 0.1%  in February after a 0.2% drop in January. The Commerce Department reported that construction stands at a seasonally adjusted annual rate of $945.7 billion, 8.7% above the level of a year ago. Residential construction dropped 0.8%, the biggest setback since July. This is believed to be a temporary drop.

CoreLogic reported home prices rose 0.8% month over month from January and 12.2%compared to February 2013. This represents 24 months of consecutive year-over-year price increases. CoreLogic’s month-to-month prices aren’t adjusted for seasonal patterns. California was one of the five states with the highest home appreciation at 19.8%. CoreLogic predicts a10.5% year-over-year increase for March.

Zillow released a report this week showing that only around 43% of homes on the market in the Los Angeles area are affordable by  historic standards, meaning that a family could buy the home and  spend 35% or less of their household income. This is the number that was the average from 1985 through 2000 before the housing bubble. Today the average family would need to spend 39% of its income on a mortgage which is the highest rate of anywhere in the country.

All in all the Real Estate market seems to be in the mist of a spring pick up. Our closed escrows were up about 20% from February as the selling season has picked up steam. Some areas are beginning to see more listings, but most of our market suffers from very low inventory. We really need to see inventory levels increase before prices can level! With property and income tax due over the next two weeks it is possible we could see things cool off a little for a few weeks. It’s pretty common this time of year. If that should happen, don’t panic! It will roar back by the end of April!


Rodeo Realty President Syd Leibovitch Quoted In The Los Angeles Times Discussing The Spring Real Estate Market

House sold signThere has been a lot of conversation lately about what the housing market will look like this spring. After a year of emphatic recovery in 2013 in which prices saw double-digit increases in the Los Angeles area, there is some concern that this spring’s season will be less robust. Recent numbers from DataQuick show that prices in February were mostly flat and sales fell. However winter is traditionally a slow month for housing sales but year-over-year data has been low.

For their article on the current state of the market, the Los Angeles Times turned to Rodeo Realty President Syd Leibovitch to get his take on local real estate. He told the Times that he predicts a busy spring, especially as inventory concerns start to ease around the Southland. Syd predicts a busy spring noting that more homes have come on the market and some are selling well above asking price, noting that the demand influx is starting and ” it seems to be starting big time.”

As California’s economy and unemployment situation continues to improve it will likely also boost the housing market. For the complete story, please visit the LA Times website.

Economic Update For The Week Ending February 14, 2014 With Syd Leibovitch

economicupdate0214This week the stock market saw another week of positive territory with strong gains seen in all three indices as investors took into account bad weather as an excuse for some soft economic data. While U.S. export prices rose 0.2%  in January, the third straight monthly increase, factory production fell 0.8% in January, the biggest drop in more than 4-1/2 years. The Dow closed out the week at 16,154.39 up 2.28%  from last week’s close of 15,794.08. The Nasdaq was also up, ending the week at 4,244.03 up 2.86% from last week’s 4,125.86 close. The S&P 500 ended the week at 1,838.63, up 2.32% from last week’s 1,797.02 close.

The  10-year Treasury note yield rate rose slightly to 2.75% after ending last week at 2.71%. It was 2.00% a year ago.

Interest rates saw a slight rise this week after several lower weeks. The Freddie Mac Weekly Primary Mortgage Market Survey showed that the 30-year-fixed rate up to 4.28% from 4.23% last week.  The 15-year-fixed stayed solid at 3.33% the same as last week’s 3.33%. A year ago the 30-year fixed was at 3.53% and the 15-year was at 2.77%.


The latest quarterly report from the National Association of Realtors® shows that the

median existing single-family home price increased in 73% of measured markets, with 119 out of 164 metropolitan statistical areas (MSAs) showing gains based on closings in the fourth quarter compared with the fourth quarter of 2012. Forty-two areas, 26 % had double-digit increases. The national median existing single-family home price was $196,900 in the fourth quarter, up 10.1%  from $178,900 in the fourth quarter of 2012. In the third quarter the median price rose 12.5% from a year earlier. In the West, existing-home sales dropped -12.7% in the fourth quarter, and are -8.1% below a year ago. Lack of inventory remains a concern. The median existing single-family home price in the West jumped 15.5% to $286,200 in the fourth quarter from the fourth quarter of 2012.


Credit reporting agency TransUnion released a report showing that the amount of late payments on home loans has hit the lowest level in more than 5 years. Nationwide, 3.85% of mortgage holders were at least two months behind on their payments in the October-December quarter, compared to 5.08% a year before.


The California Association of Realtors®reported that the percentage of home buyers who could afford to purchase a median-priced, existing single-family home in California in the fourth quarter of 2013 was unchanged from the third quarter of 2013 at 32%, but was down from 48% in fourth-quarter 2012, according to C.A.R.’s Traditional Housing Affordability Index (HAI).  Home buyers needed to earn a minimum annual income of $89,240 to qualify for the purchase of a $431,510 statewide median-priced, existing single-family home in the fourth quarter of 2013.The median home price was $352,450 in fourth-quarter 2012, and an annual income of $66,860 was needed to purchase a home at that price. California housing affordability hit a record high of 56% in first quarter of 2012 but has steadily declined since then. In Los Angeles the affordability index in the fourth quarter of 2013 was 34%, down from the third quarter’s 35% and much reduced from the fourth quarter of 2012’s 50%.

DataQuick reported that home prices fell 3.8% in January compared with December and sales were down -9.9% year over year, though the median price was up 18.4% compared with January of last year. January’s median home price, $380,000, is the lowest since May 2013.  For the six-county Southland area 14,471 new and resale homes and condos were sold last month, a three-year low for January. For Los Angeles alone, 5,308 homes were sold, a -7.4% decrease from January 2013. The median price however rose 20.6% from $340,000 to $410,000.

 There was an article this week in the L.A. Times about home prices stalling. A broker was quoted in the Inland Empire. That is not what is happening here! I doubt it’s happening there either. We definitely need more homes on the market as we are seeing record sales prices! We all should have bought more Real Estate in the last few years. Let’s not be saying the same thing at years end! 

Economic Update For The Week Ending January 24, 2014 with Syd Leibovitch

economic update 01242014Stocks took a substantial slide this week as the Dow closed the week under the 16,000 mark with both the Dow and S&P 500 taking their worst weekly losses in over a year. There was a substantial selloff on Thursday as investors digested weak Chinese economic data and dealt with currency drops in emerging markets. Some economists are saying that this may be the beginning of a correction in the stock market after last year’s meteoric rise. The Dow closed out the week at 15,879.11 down -3.52% from last week’s close of 16,458.56. The Nasdaq closed at 4,128.17 down -1.65% from last week’s 4,197.58 close. The S&P 500 finished the week at 1,790.29 down –2.63% from last week’s 1,838.70 close.

Interest rates dropped this week awaiting the next meeting of the Fed later this month. The Freddie Mac Weekly Primary Mortgage Market Survey showed that the 30-year-fixed rate dropped to 4.39% from 4.41% last week.  The 15-year-fixed fell to 3.44% from last week’s 3.45%. A year ago the 30-year fixed was at 3.42% and the 15-year was at 2.71%. Loans over $417,000 are about 1/2% higher in rate.

The 10-year Treasury note yield rate continues to fall this week ending at 2.75%, after last week’s 2.84% close. It was 1.88% a year ago, but reached 3% in December.

The National Association of Realtors® reported that existing home sales were up 1.0% in December increasing to a seasonally adjusted annual rate of 4.87 million in December from a downwardly revised 4.82 million in November. This is – 0.6%  below the 4.90 million-unit level in December 2012. For all of 2013, there were 5.09 million sales, which is 9.1% higher than 2012. It was the strongest performance since 2006. The national median existing-home price for all of 2013 was $197,10011.5%  above the 2012 median of $176,800, and was the strongest gain since 2005 when it rose 12.4%. The median existing-home price for all housing types in December was $198,000, up 9.9%  from December 2012. Distressed homes represented 14% of December sales; they were 24% in December 2012. Total housing inventory at the end of December fell 9.3%  to 1.86 million existing homes available for sale, which represents a 4.6-month supply at the current sales pace, down from 5.1 months in November. I use these numbers to point out that the dramatic price increase we have seen has been similar though out many areas nationally.

 Realtor.com® released its final National Housing Trend Report for 2013 which showed that the median list price for December 2013 was 8.1% above December 2012, the median age of inventory was down by -5.1% and the number of units for sale was essentially unchanged. The total inventory of homes for sale in the United States declined from 1,846,155 units in November to 1,731,017 units in December, while month-over-month inventory rose from 101 to 112 days, and the median list price declined from $197,700 to $194,500. The median price for the Los Angeles-Long Beach MSA rose 28.5% for the year, up to $455,000 while the amount of listings fell by -9.75% to 19,633 and the median age of inventory fell for the year by 12.33% to 64.

DataQuick announced that California foreclosure activity hit an eight-year low in the fourth quarter of 2013 with a total of 18,120 default notices filed on houses and condominiums from October through December, down -10.8% from 20,314 in the previous quarter and down a whopping -52.6%from 38,212 from the same period of 2012. This marks the lowest number of default notices since 15,337 were filed in the fourth quarter of 2005.

The Pending Homes Sales Index for December from the California Association of Realtors® showed that pending sales dropped -25.2%  in December to reach 68.8 down from a revised index of 92 in November, based on signed contracts. Pending sales were down 16.8% from the revised 82.8 index recorded in December 2012. The share of equity sales in December dipped to 84.3%, down from 86.4% in November. Equity sales made up 63.4%  of sales in December 2012. The share of distressed sales to total sales in Los Angeles County was 18% in December 2013. It was 14% in November and 35% in December 2012.

We are seeing activity begin to increase dramatically. Over the last week our open escrow count has began to increase rapidly. We are also seeing what appears to me as another surge in prices. This is not unusual. It is common for prices to increase steadily from February to June or so and then flatten. I’d expect the same in 2014!

Economic Update For The Week Ending January 17, 2014 by Syd Leibovitch

economicupdate1172014Stocks did a little consolidating this week as investors digested the jobs numbers and continued to ponder the strength of the economic recovery. The Dow and Nasdaq were up for the week but the S&P was slightly lower. The Dow closed out the week at 16,458.56 up 0.13% from last week’s close of 16,437.05. The Nasdaq closed at 4,197.58 up 0.55% from last week’s 4,174.66 close. The S&P 500 finished the week at 1,838.70 down –0.2% from last week’s 1,842.37 close.

On the heels of last week’s low job creation numbers there is some positive employment news, The U.S. Department of Labor reported that the number of job openings in November hit 4 million, up more than 5% from a year before and the highest level since March 2008. The number of quits rose to 2.43 million, the most since September 2008, showing that many workers are seeing more prospects out there and are willing to change jobs.

The latest survey on consumer sentiment fell in January with a reading of 80.4 as compared to a reading of 82.5 in December, well below economists’ forecasts of an 84 reading. Survey respondents may have been reacting to the recent job numbers as well as a slight uptick in the average price of gasoline (up to an average of $3.296 per gallon compared to last month’s $3.216 per gallon).

U.S. housing starts fell less than expected in December. The Commerce Department reported that groundbreaking fell -9.8% to a seasonally-adjusted rate of a 999,000-unit pace, the largest percentage decline since April but above economists’ expectations of a 990,000-unit rate in December. For all of 2013, housing starts rose 18.3% to an average of  923,400-unit rate. Groundbreaking for single-family homes fell 7% to a 667,000-unit pace in December while the  multifamily homes segment declined 14.9% to a 332,000-unit rate. Permits to build homes fell 3% in December to a 986,000-unit pace but for all of 2013, permits increased 17.5% to an average of 974,700-units.

The 10-year Treasury note yield rate remained relatively steady this week ending at  2.84%, after last week’s 2.88% close. It was 1.89% a year ago.

Interest rates dropped this week awaiting the next meeting of the Fed later this month. The Freddie Mac Weekly Primary Mortgage Market Survey showed that the 30-year-fixed rate dropped to 4.41% from 4.51% last week.  The 15-year-fixed fell to 3.45% from last week’s 3.56%. A year ago the 30-year fixed was at 3.38% and the 15-year was at 2.66%.

The California Association of Realtors®  (C.A.R.) released numbers showing that California home sales fell for the fifth straight month in December partly because the distressed market plays a smaller role in the state’s housing market so there was less movement by lenders trying to move properties off their books by the end of the year.  Closed escrow sales of existing, single-family detached homes in California totaled a seasonally adjusted annualized rate of 361,890 units in December, down -6.7% from a revised 387,860 in November and down -18.6% from a revised 444,770 in December 2012. For 2013 as a whole, a preliminary 413,870 single-family homes closed escrow in California, –5.9% from a revised 2012 figure of 439,790.

Home prices rose in December according to C.A.R.  The statewide median price of an existing, single-family detached home rose 3.7% from November’s median price of $422,210 to $438,040 in December.  December’s price was 19.7% higher than the revised $365,840 recorded in December 2012, marking a year and a half of double-digit annual gains and the first time in 15 months that the annual increase was below 20%. For Los Angeles County the median sold price $439,590 was up 8.5% over November’s $405,260 price and up 19.6% over December 2012’s $367,400 price. The amount of sales was up 9.5% month over month but down -15.1% year over year. The available supply of existing, single-family detached homes for sale dropped in December to 3 months, down from November’s Unsold Inventory Index of 3.6 months, it was 2.6 months in December 2012. The median number of days it took to sell a single-family home also increased to 40.2 days in December, up from 36.7 days in November and from 38.1 days in December 2012.

The latest information from DataQuick shows that home sales across the six-county Southland area fell to a six-year-low for December while the median price paid for a home rose to the highest level in nearly six years. A total of 18,415 homes were sold in Los Angeles, Riverside, San Diego, Orange, Ventura, and San Bernandino counties last month. The number was up 6.5% from 17,283 sales in November and down -9.2% from 20,274 sales in December 2012. Last month’s sales were -24.1% lower than the average number of sales in the month of December. The median sales price for the Southland region was $395,000 last month 2.6% gain from November and 22.3% over December 2012. DataQuick attributes the numbers to investor activity decreasing as buyers faced a low inventory of homes with demand continuing to outstrip supply. The typical monthly mortgage payment Southland buyers committed themselves to paying last month was $1,594, up from $1,517 the month before and up from $1,139 a year earlier. Buyers paying cash in December accounted for 27.7% of home sales, down from 28.0% the month before and down from 35.8%  a year earlier. For Los Angeles County alone 7,198 homes were sold compared to 6,240 last December, a decrease of -13.30%. The median price in LA Country rose year over year from $352,000 to $430,000, a gain of 22.2%.

CoreLogic reported that the number of completed foreclosures and the U.S. foreclosure inventory were down in November. There were 46,000 completed foreclosures in the United States in November 2013, down -29% from 64,000 in November 2012. Month over month foreclosures were down 8.3% from 50,000 in October. Before the housing crash, completed foreclosures averaged 21,000 per month (2000 to 2006). The total U.S. foreclosure inventory dropped 34% with 812,000 homes in some stage of foreclosure in November, compared to 1.2 million in November 2012. Foreclosure inventory represented 2.1% of all homes with a mortgage, compared to 3% in November 2012. The rate of seriously delinquent mortgages is at its lowest level since November 2008.

Realty Trac reported that foreclosure activity dropped by -26% in 2013 and  U.S. homes that got started on the path to foreclosure fell last year to a low not seen since before the housing boom. Foreclosure starts were down 33% from a year earlier and at the lowest annual level since 2006.

The National Association of Home Builders released their latest survey which shows builder confidence holding relatively steady.  The NAHB/Wells Fargo Housing Market Index was at 56 points in January from a downwardly revised 57 in December. The December reading originally reported at 58 was the highest level since August. Rising prices, low interest rates and continued demand continue to make home builders optimistic about the current market.

The Consumer Price Index increased 0.3% in December, the largest 1-month increase since June 2013 however much of that was due to energy prices. Year-over-year prices rose 1.5%, well under the Federal Reserve’s 2% inflation target.

very active. We are starting to see the beginning of another price surge!

Economic Update For The Week Ending January 10 by Syd Leibovitch

stats01102014The labor market closed out 2013 by adding just 74,000 jobs in December, the lowest number of new jobs since January 2011. However, the unemployment rate fell from 7% to 6.7%, the lowest since October 2008, the Labor Department said, mostly due to a drop of 347,000 in the labor force — the number of Americans working or looking for work. Most economists feel that the low number was an outlier and not an indicator of the future of the job market. By contrast, ADP’s survey showed that businesses added 238,000 jobs in December, the most in 13 months and economists were predicting a jobs report closer to the 200,000 mark.  The Labor Department’s report showed businesses added 87,000 jobs while federal, state and local governments cut 13,000. Job gains for November were revised upward to 241,000 from 203,000. All told the economy gained an average of 182,000 jobs per month in 2013 essentially the same as in 2012 (2.18 million jobs in 2012, 2.19 million in 2012). Congress continues to debate an unemployment insurance bill that would extend emergency unemployment insurance for the 1.4 million Americans.

This disappointing job report caused rates to drop sharply throughout the day. By the end of the day rates dropped by about 1/8% in rate or 1% in loan fee! It was a shockingly low number that took everyone by surprise. The question now is: what does this do to the Federal Reserves announced drawing down of mortgage and bond buying stimulus program? The announced draw down has driven rates up.

Stocks were mixed this week as investors processed the jobs numbers as well as disappointing returns from Sears, and news that the Target credit card data breach was larger than expected. TheDow closed out the week at 16,437.05 down –0.2% from last week’s close of 16,469.99. The Nasdaq closed at 4,174.66 up 1.03% from last week’s 4,131.91 close. The S&P 500 finished the week at 1,842.37 up 0.6% from last week’s 1,831.37 close.

The 10-year Treasury note yield rate spent the week diving back under 3% ending at  2.88%, after last week’s 3.01% close, the highest number seen since July 2011.  It was 1.91% a year ago.

Interest rates remained relatively flat this week as the Market waits the see how the Federal Reserve will move forward with the bond-buying program. Policy makers at the Fed including the newly-appointed Janet Yellen will meet later this month to set the pace for the bond-buying taper. The Freddie Mac Weekly Primary Mortgage Market Survey showed that the 30-year-fixed rate dropped slightly to 4.51% from 4.53% last week.  The 15-year-fixed rose to 3.56% from last week’s 3.55%. A year ago the 30-year fixed was at 3.40% and the 15-year was at 2.66%. Expect these rates to be lower when announced next week due to today’s drop. Jumbo and high balance conforming rates are about 3/8% higher than the Freddie Mac rate.

The new mortgage rules issued by the Consumer Financial Protection Bureau take effect today. The rules are designed to discourage predatory lending. Most lenders have already adopted these practices so there shouldn’t be too much difference however there will be increasing attention paid to a borrower’s debt-to-income ratio; it may become harder for people with higher debt loads to get approved for a new home if they cannot stay below the 43% debt-to-income ratio.

The latest Fannie Mae Monthly National Housing Survey for December shows that 49% of U.S. adults say home prices will rise throughout 2014, up from 43% in December 2012. The survey showed that 33% of homeowners say it’s a good time to sell, up from 21% a year ago. People also believe that home values will rise more this year: 3.2% in December compared to 2.6% in December 2012.
CoreLogic released data showing that U.S. home prices increased 0.1% in November, up 11.8%from a year ago but showing a slowing pace of increase. These figures aren’t adjusted for seasonal patterns.