Stock markets rebounded in March – Despite the first interest rate hike by The Federal Reserve since 2018, the highest inflation rates since 1982, the war in Ukraine, and spiking gas prices, stock markets made up almost all of their steep February losses. The reasons attributed to the rebound were strong job gains, robust corporate profits, an increase in retail sales, and a large drop in coronavirus cases. Treasury bond yields and mortgage rates which dropped to record lows during the pandemic rose sharply in March. They are now at their highest rates since 2018. The Dow Jones Industrial Average closed the month at 34,678.35 up 2.9% from 33,892.60 on February 28, 2022. It is down 4.6% year-to-date. The S&P 500 closed the month at 4,530.41, up 3.4% from 4,373.94 last month. It is down 5.0% year-to-date. The Nasdaq closed the month at 14,220.52 up 3.4% from 13,751.40 last month. It is down 9.1% year-to-date.
U.S. Treasury bond yields – The 10-year treasury bond closed the month yielding 2.32%, up from 1.83% last month. The 30-year treasury bond yield ended the month at 2.44%, up from 2.17% last month. We watch bond yields because mortgage rates often follow treasury bond yields.
Mortgage rates – The March 31, 2022 Freddie Mac Primary Mortgage Survey reported that mortgage rates for the most popular loan products were as follows: The 30-year fixed mortgage rate was 4.67%, up from 3.89% last month. The 15-year fixed was 3.83%, up from 3.14% last month. The 5-year ARM was 3.50% up from 2.98% last month.
U.S. employers added 431,000 new jobs in March – The Department of Labor and Statistics reported that 431,000 new jobs were added in March. Economists surveyed had expected 490,000 new jobs. The unemployment rate fell to 3.6% in March, down from 3.8% in February. The labor-force participation rate (the share of workers with a job or actively looking for a job) rose to 62.4% in March, up from 62.3% in February. It is still well below the 63.6% level before the pandemic but has moved up steadily as more people are returning to the workforce. Average hourly wages, an indicator of inflation increased 5.6% from March 2021.
Monthly home sales and pricing figures are released by the California Association of Realtors and the National Association of Realtors on the third week of the month for the previous month. These are February’s results.
February U.S. existing-home sales – The National Association of Realtors reported that existing-home sales totaled 6.02 million on a seasonally adjusted annualized rate in February, down 7.2% month-over-month from the annualized rate of sales in January. Year-over-year sales were down 2.4% from the annualized rate of 6.17 million in February 2021. The median price of a home in the U.S. in January was $357,300, up 15.0% from $303,600 one year ago. February marked a record 120 consecutive months of year-over-year increases in the median price. Inventory levels remained at record lows. There was just a 1.7-month supply of homes for sale in February, down from a 2.0 month supply in February 2021. First-time buyers accounted for 29% of all sales. Investors and second-home purchases accounted for 22% of all sales. All-cash purchases accounted for 25% of all sales. Foreclosure and short-sales accounted for less than 1% of all sales remaining at a historic low.
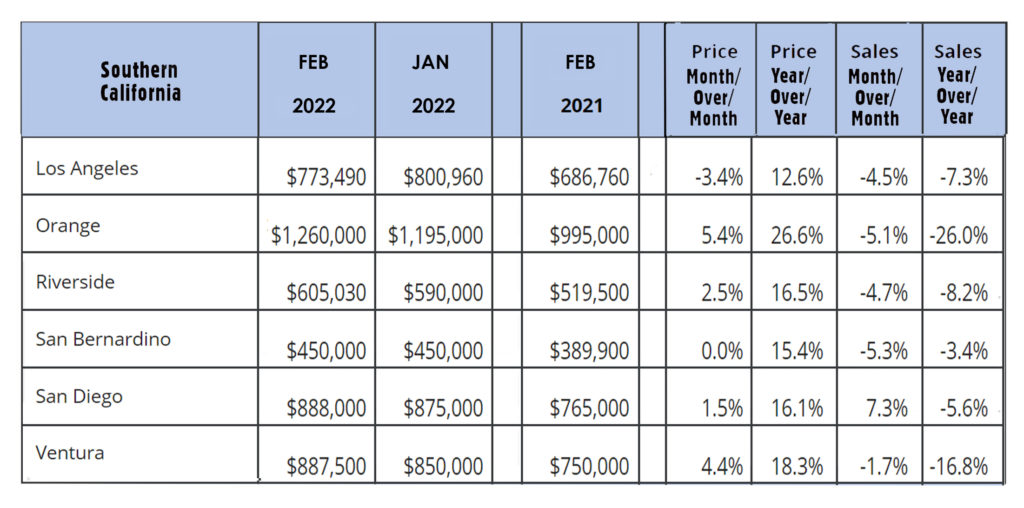
February California existing-home sales – The California Association of Realtors reported that existing-home sales totaled 424,640 on a seasonally adjusted annualized rate in February. That marked a 4.5% month-over-month decrease from the number of homes that closed escrow in January and a year-over-year drop of 8.2%. The median price paid for an existing home in February was $771,270, up 10.3% from last February when the median price was $699,000. There was a 2-month supply of homes for sale in February, down from 2.1 months in February 2021
The chart below shows regional figures.