2018 Year End Economic Update

New York Stock Exchange

2.6 million new jobs were added in 2018 as unemployment dropped to a 40-year low – The Bureau of Labor Statistics reported that U.S. employers added 312,000 new
jobs in December. This shocked analysts that had forecasted 178,000 new jobs. 
There were 2.6 million jobs added in 2018, up from 2.2 million new jobs in 2017. The unemployment rate rose to 3.9% from 3.7% in November, a 40-year low, as 419,000 new workers entered the workforce. Optimism about finding an acceptable job and
higher wages were credited with expanding the workforce. Wages rose 3.2% from
one year earlier, matching October’s year over wage gains which marked the largest
year over year wage gain since April 2009. 

Stock markets ended the year lower in 2018 – After hitting all-time highs in
September, which marked the longest bull market in history, stocks took a downturn in the last quarter of the year. December marked the worst December drop since the Great Depression as fears of a trade war, political uncertainty, slowing economic activity overseas, and higher interest rates made investors more cautious. The Dow Jones Industrial Average ended 2018 at 23,327.46, down from 24,719.22 at the close of 2017.The S&P 500 closed the year at 2,506.85, down from 2,673.51 at the end of 2017. The NASDAQ closed at 6,635.28, down from 6,903.39 on December 31, 2017. 

U.S. Treasury Bond Yields higher in 2018 – The 10-year U.S. treasury bond closed the year at a 2.69% yield, up from 2.40% on December 31, 2017. The 30-year treasury yield ended the year at 3.02%, up from 2.74% on December 31, 2017.Mortgage Rates higher in 2018 – The December 28, 2017 Freddie Mac Primary Mortgage Survey  reported that the 30 year fixed mortgage rate average was 4.55%, up from 3.99% on December 29, 2017. The 30-year fixed rate was over 5% in October before
declining in November and December. The 15-year fixed was 4.01%, up from 3.44% . last December. The 5-year ARM was 4.00%, up from 3.55% at the close of 2017. Fortunately, rates dropped in the final quarter. The 30-year hit 5% in September. 

Year over year price gains moderated in 2018 after 7 years of price gains. For the first 7 months of the year we saw the same month year over year price increases of
6-8%, but by years end those prices were just 1.5% above the same month one year earlier – The California Association of Realtors reported that existing home sales 
totaled 372,260 in December on a seasonally adjusted annualized basis. That was 
down 11.6% from last December. It marked the fewest sales in a month since January 2015. The statewide median price was $557,600, up 1.4% from December 2017.
On a regional basis Los Angeles County’s median-price of $588,140 was up 1.8% 
from last December. Orange County had a median price of $785,000, down 0.1%
from December 2017. Ventura County’s median price of $640,000 was down 0.8% from last December. Inventory levels also continued to rise. Active listings have
increased 30% from 2017. The unsold inventory index hit record lows before moving up steadily in the last 9 months of 2018. There was a3.5-month supply of homes
listed in California, up from a 2.5-month supply in December 2017. It should be noted that a “normal market” has a six-month supply of homes listed, so inventory levels
which are well above the all-time lows of 2017 are still at low historical levels.
 Los Angeles County had a 3.5-month supply, up from a 2.4-month supply last
December. Orange County had a 4-month supply, down from 2.6 months last
December. Ventura County had a 5.5-month supply, up from a 4-month supply in
December 2017.

New Year’s Resolutions for your Home

1: Streamline the stuff

One of the best and least expensive ways to feel better about your home is to clear it of clutter.

Each year most of us acquire a mountain of stuff. Without some regular purging, cabinets and drawers get jam-packed and it becomes hard to find the things you use and enjoy the most. (All that clutter also makes your house look dated and dirty, designers say.)

This year resolve to go room-by-room periodically clearing anything that you don’t use, wear or love and donate it to charity. After that, think twice about what you bring in, says Antoinette Nue, an Atlanta consultant who specializes in helping people simplify and go green.

“Fill your home with the things that raise your energy level and make you feel good, and get rid of the things that drain your energy or are broken,” she says.

Stash useful (but not beautiful) items such as DVDs, remotes and those kicked-off shoes in simple woven baskets. Group similar items together on sleek trays, says Stuart McCormick, a designer with Liz Levin Interiors in Washington D.C.

Clear your counters of everything you don’t use on a daily basis. And get ready to breathe a little easier in your own home. 

2: Make it safe and sound

Your home may be beautiful, but is it safe?

First, check your house for radon. This colorless, odorless gas causes about 21,000 lung cancer deaths each year from the radioactive particles it traps in your lungs as you breathe, according to the U.S. Environmental Protection Agency. One in every fifteen homes has elevated levels. And with test kits costing as little as $20 at your local hardware store, there’s no reason not to get right on that.

While we’re on the subject of deadly gas, make sure you install a carbon monoxide detector on every bedroom floor in addition to fire detectors. If a chimney flue or furnace vent gets blocked or leaks, carbon monoxide could back up in your house and kill you. Like a radon test, this is a small investment — $40 or more — for such an important safeguard.

Watch out for dryer lint. We know you clean the little trap inside the door, but most people neglect to clean the vents and ducts behind the dryer. Lint may seem innocent, but it’s highly combustible, according to the U.S. Fire Administration, accounting for more than 15,000 building fires a year.

Make sure your house can breathe. Many people’s bathrooms and attics aren’t vented to the outside (or the vents are covered over with shingles.) This makes you a prime candidate for mold.

And if you’re considering a remodel — and your home was last built or remodeled before 1978 — consider testing for lead paint and asbestos flooring. It will have to handled properly during removal, or particles can be released into the air for you to ingest.

3: Shrink your bills (and your carbon footprint in the process)

When people think of going green, they often think it takes solar panels to make a difference.

Not so, says Bob Schildgen, who wrote the “Hey Mr. Green” column for Sierra magazine. It just takes a little old-fashioned common sense.

The best place to start is by cutting your energy usage in your home:

– Remember your mom’s advice and switch off the lights when you leave a room.

– Turn off your air conditioner when you leave the house and dial your heater down to 55 degrees at night.

– Install LED bulbs and low-flow showerheads.

– Turn off your power strips and/or set your home computer to revert to sleep mode when not in use.

– Water your yard less. Put in drought-tolerant landscaping if necessary.

– Give composting a try. Your garden will thank you.

4: Work out a weekly system for keeping your house clean

Here are a few tips for keeping the mess under control from Jeff Campbell. He is the author of the book Speed Cleaning and owner of the Clean Team housekeeping service in San Francisco.

Daily: Dishes go in the dishwasher every night – no excuses! Dirty clothes go in the hamper and jackets or clean clothes are hung in the closet. Bring everything back to its assigned place.

Weekly: Clean your entire house, using these tips:

– Keep all of your cleaners in a portable carryall that moves with you from room to room.

– Focus on one type of cleaning at a time. It’s faster, Campbell says. Wipe down fingerprints on all of the cabinets, for instance, before moving on to spraying and wiping counters. Then move on to windows and mirrors and appliances. Once that’s done move on to sweeping and then mopping floors.

– For optimum efficiency, enlist the help of your family. If you can, divide the jobs among at least three parties. One of you can do the dusting/vacuuming and changing beds. The other can do the bathroom cleanup, leaving only the kitchen and trash emptying for you to handle. The upside? You can get the whole house done in 45 minutes, Campbell says. Leaving more time on the weekends for the park or the movies.

5: Get your place ready for entertaining

Each year most of us vow to spend more time with family and friends. To make you feel like inviting people in, why not give the areas you entertain in a little update?

You don’t have go for broke here and invest in a new kitchen remodel. All it takes to get a fresh new look is a little bit of rearranging and a few updates, says designer McCormick.

One easy update that makes your home seem more “finished” is the addition of plants, she says.

“They bring in new energy and help clean the air,” she says. “And it’s a great way to decorate if you’re on a budget.”

Pulling out a new accent color from your existing decor can make the whole room seem fresh. Pick an underused color in the room and add more of it in the form of a new pillow or throw to update your look, McCormick advises. A colorful rug or runner can also help anchor your space.

Lastly, take some time to rearrange your furniture so it is oriented in conversation groups and not just facing the television. That just might up for chances for real conversation and connection in the New Year.

Courtesy of HGTV

Economic update for the month ending October 31, 2018

U.S. Employers added 250,000 new jobs in October:

Wages grow at fastest pace in almost 10 years – Unemployment remains at lowest rate since 1969 – The Department of Labor Statistics reported Friday that 250,000 new jobs were added in October. That eclipsed the 190,000 new jobs analysts had expected. Job growth has now hit a record of 97 straight months. The unemployment rate was unchanged at 3.7%, the lowest national unemployment rate in 49 years. Average hourly wages were up 3.1% in October from last October. That was the largest year over gain in almost 10 years. 


California employers added 13,200 new jobs in September :

The California Employment Development Department reported that 13,200 new jobs were added in September. California has now added an average of 29,400 new jobs a month for 103 consecutive months. The state’s unemployment rate dropped to 4.1%, the lowest rate on record. 


U.S. stocks saw their largest monthly loss in 10 years in October:

 Although most companies reported quarterly profits that beat or were in line with expectations, the few like Amazon, Square, Hasbro, Domingo’s  and others  that reported disappointing results scared investors. The Dow Jones Industrial Average closed the month at 25,115.76, down from 26,458.31. last month. The S&P 500 closed the month at 2,711.74, down from 2,913.98 on September 30The NASDAQ closed the month at 7,305.90, down from 8,046.35 last month.   


Treasury Bond Yields rise:

The 10-year treasury bond closed the month yielding 3.05%, up from 2.86% on August 31, 2018. The 30-year treasury bond yield ended the month at 3.19%, up from 3.02% at the end of August. 

Mortgage rates higher in October:

 The November 1, 2018 Freddie Mac Primary Mortgage Survey reported that the 30-year fixed mortgage rate average was 4.83%, up from 4.72% on September 27, 2018The 15-year fixed was 4.23%, up  from 4.16% on September 27.  The 5-year ARM was 4.04%, up from 3.97% at the end of September. 


GDP up 3.5% in third quarter:

The U.S. Bureau of Economic Analysis announced that the first reading of the nation’s gross domestic product (GDP) rose by 3.5% in the third quarter of 2018.   That beat expectations of a 3.4% rise, but was well below the 4.2% increase registered in the second quarter of 2018. The report also said that The PCE price index, a key indicator of inflation, rose at a 1.6% annual rate in the quarter. That was well below the 2.2% annual increase analysts forecasted. Consumer spending, which accounts for about two thirds of the U.S. economy grew by 4% in the third quarter. That marked the largest increase since the fourth quarter of 2014. 


September Nationwide Existing Home Sales:

 Data released this week from The National Association of Realtors showed that total existing home sales fell again in September. The number of existing homes sold in September fell 3.4% from August, and are down  4.1%  from one year ago. The median price paid for a home in The U.S. was up 4.2% from last September. That marked the 79th straight month of year over increases. The unsold inventory index is at a 4.4 month supply, up slightly form a 4.2 month supply one year ago. 


September California Existing Home Sales:

The California Association of Realtors reported that existing single family home sales totaled 382,550 in September on a seasonally adjusted annualized rate. That was down 4.3% from August and down a staggering 12.4% from last September, when sales totaled 436,920 on a seasonally adjusted annualized rate. The median price paid for a home in California was $587,850, up 4.2% from September 2017.On a more regional level the median price increased 4.7% in Los Angeles County10.6% in Ventura County, and 3.3% in Orange County from one year ago. Inventory levels continued to rise after hitting historic lows in 2017. The unsold inventory index in California stood at a 4.2 month supply in September, up from a 3.3 month supply in September 2017. Inventory levels have now increased for 6 straight months and are up 20.4% from one year ago. Listings are at the highest level in 31 monthsLos Angeles County has a 4.4 month supply, up from a 3.1 month supply last September. Orange County has a 4.3 month supply,  up  from 3.1 months last September. Ventura County had a 6.3 month supply of homes, up from a 4.7 month supply one year ago. 

Best,
Syd Leibovitch 
Rodeo Realty Inc.
9171 Wilshire Blvd. Suite 321
Beverly Hills, California 90210
CA DRE # 00858724

Economic Update For January 2014 With Syd Leibovitch

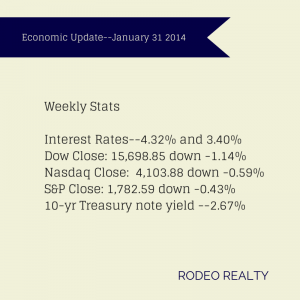
economicupdate01312014January saw some corrections in the stock market with the S&P 500 and the Dow posting their biggest monthly percentage decline since May 2012. This was the first January since 2010 with a decline.

The Dow closed out the month at 15,698.85  down -5.3% from last month’s close of 16,576.60 and down -1.14% from last week’s close of 15,879.11.

The Nasdaq fared a bit better, ended the month at 4,103.88 down -1.7% from last month’s close of 4,166.66 and down -0.59% from last week’s 4,128.17 close.

The S&P 500 ended the month at 1,782.59, a drop of -3.56% from last month’s 1,848.36 close and down -0.43% from last week’s 1,790.29 close.

Interest rates dropped during the month. The Freddie Mac Weekly Primary Mortgage Market Survey showed that the 30-year-fixed rate dropped to 4.32% from 4.39% last week and 4.53% at the start of the month.  The 15-year-fixed fell to 3.40% from last week’s 3.44% and 3.55% at the start of the month. A year ago the 30-year fixed was at 3.53% and the 15-year was at 2.81%.

Over the course of January 10-year Treasury note yield rate fell after starting the month at 3.0%  It closed out the month at 2.67%  after ending last week at 2.75%. It was 2.02% a year ago.

Los Angeles County’s unemployment rate fell to 9.2% in December down from 9.5% in November and 10.3% in December 2012. This is its lowest point in more than five years. The state rate is 8.3% and the national rate was 6.7% in December.

Consumer confidence has risen again. The Conference Board reported that the consumer confidence index increased to 80.7 this month from a downwardly revised 77.5 in December beating economists’ estimates of a 79 reading. The index is now higher than it was in September before the confidence-eroding government shutdown and is at its highest level since August. However the consumer sentiment gauge from the University of Michigan and Thomson Reuters registered a final reading of 81.2 in January, down from December’s 82.5. In December, consumer spending rose a seasonally adjusted 0.4% which was above analysts’ expectations of a 0.2% gain. Economists are predicting consumer spending will rise at least 2% over the course of the year.

The Commerce Department reported that sales of new U.S. homes decreased -7% to a 414,000 annualized pace in December, lower than was predicted by economists who predicted a 455,000 pace last month. For all of 2013, demand was up 16.4% to 428,000. The median sales price of a new home rose 4.6%  from December 2012 to $270,200. New-housing demand has rebounded from a record-low 306,000 homes sold in 2011, the record peak was 1.28 million in 2005. I would attribute this to very low inventory which is also causing rapid price increases.

The latest S&P/Case-Shiller Home Price Index shows that the 20-city composite rose 13.7% year over year through November 2013 while declining -0.1% from the previous month. Nine out of 20 cities recorded positive  monthly returns  including Los Angeles which saw a 0.1% increase. It is predicted that while housing prices will continue to rise, the pace of the rise will be slower in 2014.

The National Association of Realtors reported that its Pending Home Sales Index dropped -8.7%last month to 92.4, the lowest level since October 2011. Contracts were down 8.8% from the December 2012 levels. It is believed that unusually harsh weather across the country caused the low numbers of potential buyers. The index in the West dropped 9.8%  in December to 85.7, and is 16.0%  below December 2012 and this is attributed to  the lack of inventory in the market.

As I wrote last week we are beginning to see another increase in prices and buyer demand. It appears that 2014 will be much like 2013. The question is: How high can prices go? That’s not a new question. We recently sold a home in Beverly Hills for $15 million that the buyer bought for $475,000 in 1976! A valley home that just sold for $630,000 was purchased for $98,000 in 1980. All my life, with the exception of a few down years every 20 years or so, I have been hearing the question: How high can prices go? The answer is: Who knows! Definitely they are going up. The question is how long. I’d expect these gains to begin to level in a year or so. Anyone who doesn’t buy now will wish in 6 months that they did!

California Association of Realtors Predicts A Strong Housing Market For 2014

House sold signThe California Association of Realtors (C.A.R.) has released its forecast for 2014 and sees a continued improvement in the state’s housing market. The organization predicts fewer distressed as sales shifting toward primary home buyers with both sales and home prices posting further gains. The C.A.R. “2014 California Housing Market Forecast” shows sales gaining 3.2% percent next year to reach 444,000 units, up from the projected 2013 sales figure of 430,300 homes sold.  Sales in 2013 will be down 2.1% from the 439,400 existing, single-family homes sold in 2012.

“The housing market has improved over the past year, and we expect this trend to continue into 2014,” said C.A.R. President Don Faught.  “As the economy enters the fourth year of a modest recovery, we expect to see a strong demand for homeownership, as buyers who may have been competing with investors and facing an extreme shortage of available housing return from the sidelines.”

The C.A.R. forecast also projects growth in economy and job markets. It is predicted that the U.S. Gross Domestic Product will grow 2.8% in 2014, after a projected gain of 1.8% in 2013.  With nonfarm job growth of 1.9%  in California, the state’s unemployment rate should decrease to 8.3% in 2014 from 9% in 2013 and 10.5% in 2012. The prediction is that the average rate for 30-year fixed mortgage interest rates will rise to 5.3%. The California median home price is forecast to increase 6 percent to $432,800 in 2014, following a projected 28 percent increase in 2013 to $408,600.

C.A.R. Vice President and Chief Economist Leslie Appleton-Young spoke on the changing market: “As the market continues to improve, more previously underwater homeowners will look toward selling, making housing inventory less scarce in 2014.  As a result of these factors, we’ll see home price increases moderate from the double-digit increases we saw for much of this year to mid-single digits in most of the state. The wildcards for 2014 include federal, fiscal, monetary and housing policies – such as the mortgage interest deduction and mortgage finance reform – as well as housing supply and the actions of the Federal Reserve, which will ensure a higher rate environment.”


2014 CALIFORNIA HOUSING FORECAST

Indicator 2008 2009 2010 2011 2012 2013f 2014f
SFH Resales (000s)

381.4

474.9

416.5

422.6

439.4

430.3

444.0

% Change

30.4%

24.5%

-12.3%

1.4%

4.0%

-2.1%

3.2%

Median Price ($000s)

$348.5

$275.0

$305.0

$286.0

$319.3

$408.6

$432.8

% Change

-37.8%

-21.1%

10.9%

-6.2%

11.6%

28.0%

6.0%

30-Yr FRM

6.0%

5.0%

4.7%

4.5%

3.7%

4.1%

5.3%

 1-Yr ARM

5.2%

4.7%

3.8%

3.0%

2.7%

2.7%

3.1%

 f= forecast