 Stocks were mixed this holiday-shortened week responding to a mixed bag of news. Inflation reports show inflation remains low. In January, overall prices rose 1.6% from a year ago. Prices of most commodities rose modestly while the shelter index was up at 2.6% compared to a year ago because rents are rising.
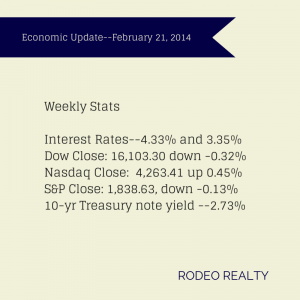
The Dow closed out the week at 16,103.30 down -0.32% from last week’s close of 16,154.39. The Nasdaq was up, ending the week at 4,263.41 up 0.45% from last week’s 4,244.03 close. The S&P 500 was down very slightly, closing the week at 1,838.63, down -0.13% from last week’s 1,838.63 close.
The 10-year Treasury note yield rate was down slightly to 2.73% after ending last week at 2.75%. It was 1.99% a year ago.
Mortgage Interest rates rose slightly this week. The Freddie Mac Weekly Primary Mortgage Market Survey showed that the 30-year-fixed rate up to 4.33% from 4.28% last week. The 15-year-fixed inched up to 3.35% from last week’s 3.33%. A year ago the 30-year fixed was at 3.56% and the 15-year was at 2.77%. Interest rates on loans over $417,000 are around 4.625% for 30 year fixed and 3.625% on 15 year fixed.
Low inventory continues to have a constraining effect on California home sales. The California Association of Realtors® reported that closed escrow sales of existing, single-family detached homes in California totaled a seasonally adjusted annualized rate of 363,640 units in January, marking the third straight month that sales were below the 400,000 level and the sixth straight decline on a year-over-year basis. Sales in January were up 0.3% from a revised 362,430 in December but were down -13.8% from a revised 421,780 in January 2013. Inventory at the higher end of the market, priced $1 million and higher did increase 11.1% from last year. The statewide median price of an existing, single-family detached home fell -6.2% from December’s revised median price of $438,090 to $410,990 in January. January’s price was 22.1% higher than the revised $336,650 recorded in January 2013, marking 23 consecutive months of year-over-year price increases and the 19th straight month of double-digit annual increases. The available supply of existing, single-family detached homes for sale rose in January to 4.3 months, up from December’s Unsold Inventory Index of 3 months. The index was 3.5 months in January 2013. The median number of days it took to sell a single-family home also increased to 44.3 days in January, up from 40.2 days in December and from a revised 36.7 days in January 2013.
In Los Angeles County alone, the median sold price of existing homes was down –3.7% in January from December’s $439,830 to $423,570 which is up 21.1% from January 2013’s $349,720 median price. Total sales were down– 21.2% month over month and down -13.3% from January 2013.
Data from the National Association of Realtors® showed that existing-home sales fell by -5.1%from December to January to a seasonally adjusted annual rate of 4.62 million the lowest level since July 2012. Home sales were also down -5.1% year over year. The cold weather, low inventory, and rising mortgage rates are cited as potential reasons for the lower numbers. Inventory improved modestly, up 2.2% month over month to 1.9 million homes and up 7.3% from January 2013. The current inventory supply rate is now 4.9 months, up from 4.6 months in December and 4.4 months a year ago. The median existing home price for all housing types nationwide in January was $188,900, up 10.7% from January 2013. The median time on market for all homes was 67 days in January, down from 72 days in December and 31% of homes sold in January were on the market for less than a month. Existing-home sales in the West dropped -7.3% to a pace of 1.01 million in January, and are -13.7% below a year ago. The median price for the West was $273,500, up 14.6% from January 2013.
The latest foreclosure data from RealtyTrac shows that one in every 1,058 U.S. homes received a foreclosure filing in January. Foreclosure filings are down -18% from January 2013 but up 8% from December 2013. The rise in foreclosure activity was caused by a surge in starts, properties just entering foreclosure, as well as scheduled foreclosure auctions. The report did show that foreclosure starts in California actually rose 57% from a year ago after 17 consecutive months of annual decreases.
The extreme weather that has hammered much of the country seems to have also impacted homebuilder confidence. The National Association of Home Builders/Wells Fargo Builder Sentiment Index is now 46, down from January’s 56 reading and the lowest level since May. Economists had been predicting a number similar to the one they saw in January. Generally a reading below 50 indicates that more builders see sales conditions as poor rather than good. Builders’ prediction for sales over the next six months also fell by six points to 54.
U.S. housing starts saw their biggest drop in nearly three years last month. The U.S. Census Bureau and the Department of Housing and Urban Development reported that single-housing family starts were down -16% in January to a seasonally-adjusted annual rate of 880,000 units below economists’ predictions of 950,000. This was attributed to the unusually cold weather gripping much of the country and in fact in the hard-hit Midwest, starts were down a record -67.7%. Groundbreaking for single-family homes, the largest segment of the market, fell 15.9 percent to a 573,000-unit pace in January, the lowest level since August 2012. Permits to build homes were down by -5.4% in January, the largest drop in since June.
The National Housing Trend Report from realtor.com® showed that the median list price for January rose 8.3% compared to last year but only up 0.1% from the previous month. The number of properties for sale was up 3.1% for the year but down -3.3% from the previous month. The median age of inventory was essentially unchanged. For the Los Angeles-Long Beach MSA the median price was $449,000 up 25.1% from a year ago but down -0.20% from the previous month. The amount of total listings was 18,600 up 3.40% from the previous year and up 5.10% from the previous month. The median age of inventory was 74 days, down -5.1% from the previous year and down -1.3% from the previous month.
We are heading into the selling season which will be a welcome relief when it comes to real estate related data. Expect to see the month over month indicators pick up after March! Not only do they pick up at that time every year, we are beginning to see the pick up in the marketplace.
While inventory levels are still near record lows we are beginning to see many more homes listed in many of our markets. That alone should increase the number of sales as we still see stronger demand than inventory supply which is evident by the high number of multiple offers. Obviously, not all homes are getting multiple offers, there is a limit to how high a home can be priced. Homes that are not well priced are sitting on the market.
