Economic Update | Week Ending November 18, 2023

Stock markets closed higher for the third consecutive week – Stock markets closed higher again this week capping off a third week of gains following a tough October. The October Consumer Price Index (CPI) was released this week. It showed that consumer prices in October had climbed 3.2% from one year earlier. While the Fed target is 2%, this was a giant step in the right direction. Inflation peaked in June 2022 at 9.1% and worked its way down every month for a year hitting 3% in June. In July, August, and September the year-over-year inflation rate worked its way back up. It was 3.7% in September, so dropping to 3.2% in October was welcome news to investors. The Producer Price Index showed inflation taming as well in October. Bond yields and mortgage rates have fallen steadily in November on this news and many experts feel that rising inflation, higher interest rates, and Fed hikes are behind us. The Dow Jones Industrial Average closed the week at 34,947.28, up 1.9% from 34,283.10 last week. It is up 5.4% year-to-date. The S&P 500 closed the week at 4,514.02, up 2.2% from 4,415.24 last week. It is up 17.6% year-to-date. The Nasdaq closed the week at 14,125.48, up 2.4% from 13,798.11 last week. It is up 35% year-to-date.

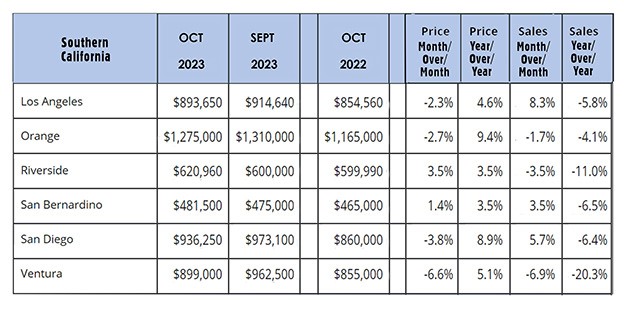
U.S. Treasury bond yields – The 10-year treasury bond closed the week yielding 4.44%, down from 4.61% last week. The 30-year treasury bond yield ended the week at 4.59%, down from 4.73% last week. We watch bond yields because mortgage rates follow bond yields.

Mortgage rates – The Freddie Mac Primary Mortgage Survey reported that mortgage rates for the most popular loan products as of November 9, 2023, were as follows: The 30-year fixed mortgage rate was 7.44%, down from 7.50% last week. The 15-year fixed was 6.76%, down from 6.81% last week. Rates dropped all week.

California existing-home sales – The California Association of Realtors reported that existing-home sales totaled 241,710 units on a seasonally adjusted annualized basis in October, down 11.9% from a revised 274,410 annualized sales pace in October 2022. October marked the thirteenth straight month of the annualized sales rate dropping under 300,000 on an annualized basis, and the second consecutive month of sales dropping below 250,000 annualized sales, a level that was thought could never happen. Year-to-date, the number of homes sold were down 27.2% in October. The statewide median price paid for a home in October was $840,360, up 5.3% from a revised $798,140 a year ago. There was a 2.7-month supply of homes for sale in October, down from a 3.1-month supply one year ago.

The graph below shows sales data by county in Southern California.

California home prices continue to surge while the number of sales dropped in August 

California home prices continue to surge while the number of sales dropped in August 

The California Association of Realtors reported that existing home sales totaled 414,860 on a seasonally adjusted annualized rate in August. That marks a 3.3% decline from the number of sales in July, and a drop of 10.9% from the number of sales in August 2020. August existing home sales were the lowest number of sales in 14 months, but are similar to number of sales that California saw in 2018 and 2019, which was a very healthy real estate market. Year-to-date sales are up 21.3% from the same period last year.

The median price paid for an existing home in August was $827,940, up 2.1% from July’s median price of  $811,170, and up 17.1% from last August when the median price was $706,900

The California Association of Realtors tracks inventory levels based on how many months it would take to sell the active listings in all MLS systems at the current sales level. There was a 1.9 month supply of homes for sale in August, down from a 2.1 month supply of homes for sale last August.

The graph below shows activity by County for Southern California.

Economic update for the month ending September 30, 2020

September marked a turbulent month for stocks – Stocks rallied on the last day of September to end the month lower, but much better than they were during the month. At one point, markets were down approximately 10% for the month. Much of the turmoil this month centered around a new round of stimulus. It was widely felt that a coronavirus stimulus package was a done deal in late August. The size and scope of that stimulus were in the range of $2-trillion to $3-trillion. It was felt that a package was days away. All stock markets hit all-time record highs in August. As prospects of a deal on the stimulus package began to fade, stocks began to drop. Over the last few days of September, a new round of negotiations between Democrats, Republicans, and Treasury Secretary Mnuchin have produced results that lead investors to feel a deal is near, and stocks have climbed. The Dow Jones Industrial Average closed the month at 27,781.70, down 2.3% from 28,430.05 last month. The S&P 500 closed the month at 3,363.01, down 4.1% from 3,500.31 last month. The NASDAQ closed the week at 11,167.31, down 5.2% from 11,775.46 last month.

U.S. Treasury bond yields – The 10-year treasury bond closed the month yielding 0.69%, down from 0.72%, last month. The 30-year treasury bond yield ended the month at 1.46%, down slightly from 1.49% last month.

Mortgage rates – The Freddie Mac Primary Mortgage Survey released on October 1, 2020 reported mortgage rates for the most popular loan products as follows: The 30-year fixed mortgage rate average was 2.88%, down from 2.91% last month. The 15-year fixed was 2.36%, down from 2.56% last month. The 5-year ARM was 2.90%, nearly unchanged from 2.91% last month.

The U.S. economy added 1.37 million jobs in August – The Department of Labor Statistics reported that employers added 1.37 million jobs in August. While that number slightly exceeded expectations, approximately 250,000 were temporary census workers hired by the federal government, so the report was pretty much what analysts expected. The unemployment rate dropped to 8.4% in August from 10.2% in July. August’s unemployment rate was the lowest since March 2020. The unemployment rate in February was 3.6% but I surged in March and April when it peaked at 14.7%. This was due to the government-ordered shutdown of the economy because of the Coronavirus pandemic. While 24.2 million people are still not working, who’s employers have either shut down or reduced staff, the economy is still on a positive track.

Home sales figures are released in the third week of the month for the previous month. These are August’s results.

California’s existing-home sales and prices hit a record high in August – The California Association of Realtors announced that existing, single-family home sales totaled 465,400 in August on a seasonally adjusted annualized rate. That marked a month-over-month increase of 16.3% from the number of sales in July. Year-over-year sales were up 14.6% from August 2019’s 406,100 sales on a seasonally adjusted annualized rate. The state-wide median price also hit a record high. It was $706,900, up 6.3% from $666,320 in July. Year-over-year the median price increased by 14.5% from $617,410 last August. That marked the steepest year over-year-increase in the median price since March 2014 when home prices were recovering from steep drops during the Great Recession financial crisis. The median price is the point at which one half the homes sell for more and one half sell for less. Historic low-interest rates with 30-year fixed at or under 3% have increased buyer demand, and very low inventory levels have created competition and pushed prices up. The unsold inventory index in August held steady at a 2.1-month supply. That was unchanged from July, but down from a 3.2-month supply one year ago. A 5-6-month supply is considered a normal market, but we have not seen that high of an inventory rate for many years. The index indicates the number of months it would take to sell the supply of homes on the market at the current rate of sales. The graph below indicates the number of sales and median prices for counties in Southern California.

The graph below indicates results from Southern California by county.


U.S. existing-home sales and prices soared in August – The National Association of Realtors reported that U.S. existing-home sales hit 6 million in August on a seasonally adjusted yearly basis. The number of homes sold in August was 10.5% higher than in August 2019. That marked the highest number of homes sold in a month since December 2006. Prices also surged. Nationally the median price paid for a home jumped 11.4% from one year ago.

Economic update for the week ending September 5, 2020

The U.S. economy added 1.37 million jobs in August – The Department of Labor Statistics reported that employers added 1.37 million jobs in August. While that number slightly exceeded expectations, approximately 250,000 were temporary census workers hired by the federal government, so the report was pretty much what analysts expected. The unemployment rate dropped to 8.4% in August from 10.2% in July. August’s unemployment rate was the lowest since March 2020. The unemployment rate in February was 3.6% but I surged in March and April when it peaked at 14.7%. This was due to the government-ordered shutdown of the economy because of the Coronavirus pandemic. While 24.2 million people are still not working, who’s employers have either shut down or reduced staff, the economy is still on a positive track.

Stock markets lost ground at the end of the week – Stocks had a losing week after five weeks of gains. Tech stocks, which have soared this year, were hit the hardest as investors took profits. The lack of a deal on another stimulus package weighed heavily on investors. It was thought to be a done deal a few weeks ago, but now some fear that with jobs showing signs of a rebound additional government stimulus may not be as hefty of a package as once thought, especially since the deficit spending this year is expected to exceed the entire GDP for the first time since World War 2. The Dow Jones Industrial Average closed the week at 28,133.31, down 1.8% from 28,653.87 last week. It’s down 1.4% year-to-date. The S&P 500 closed the week at 3,426.96, down 2.3% from 3,508.01 last week. It’s up 6.1% year-to-date. The NASDAQ closed the week at 11,313.14, down 3.3% from 11,695.63 last week. It’s up 26.1% year-to-date.

U.S. Treasury bond yields – The 10-year treasury bond closed the week yielding 0.72%, down slightly from 0.74% last week. The 30-year treasury bond yield ended the week at 1.46%, down from 1.52% last week.

Mortgage rates – The September 3, 2020, Freddie Mac Primary Mortgage Survey reported mortgage rates for the most popular loan products as follows: The 30-year fixed mortgage rate average was 2.93%, almost unchanged from 2.91% last week. The 15-year fixed was 2.42%, down from 2.46% last week. The 5-year ARM was 2.93%, almost unchanged from 2.91% last week.