Stock markets dropped in August – Although it has been an incredible year of stock market gains, August marked a challenging month. Stock markets dropped due to fears of higher interest rates. Bond yields and mortgage rates rose to the highest levels in 20 years as economic data suggested that the economy was showing no signs of slowing. The Fed increased interest rates and gave hawkish comments suggesting that high rates would remain at these levels for longer than many experts expected. In the last week of the month there was news which suggested the economy may finally be reacting to the Fed’s tightening campaign. Some inflation gauges showed moderation, second quarter GDP was revised downward to 2.1% growth, from its initial reading of 2.4%, and consumer confidence took a sudden drop. The Dow Jones Industrial Average closed the month at 34,721.91, down 2.4% from 35,559.53 on July 31st. It is up 4.7% year-to-date. The S&P 500 closed the month at 4,507.66, down 1.8% from 4,588.96 last month. It is up 17.4% year-to-date. The NASDAQ closed the month at 14,034.97, down 2.2% from 14,346.02 last month. It is up 34.1% year-to-date.
U.S. Treasury bond yields – The 10-year treasury bond closed the month yielding 4.09%, up from 3.97% last month. The 30-year treasury bond yield ended the month at 4.20%, from 4.02% last month. We watch bond yields because mortgage rates often follow treasury bond yields. Both the 10-year and 30-year closed the month about .25% below their highest levels for the month after dropping in the last week of the month.
Mortgage rates – The Freddie Mac Primary Mortgage Survey reported that mortgage rates as of August 31, 2023, for the most popular loan products were as follows: The 30-year fixed mortgage rate was 7.18%, up from 6.81% at the end of July. The 15-year fixed was 6.55%, up from 6.11% at the end of July.
Job growth was strong in August, but the unemployment rate increased – The Department of Labor and Statistics reported that 187,000 new full-time jobs were added in August. That was in line with economists’ expectations. While roughly the same number of new jobs were created as reported in July, July was revised downward by 30,000 to 157,000 today. The unemployment rate increased to 3.8% in August, up from 3.5% in July, its lowest level in almost 60 years, as more workers entered the workforce. Average hourly wages increased 4.4% from one year ago, unchanged from the previous month. The labor-force participation rate (the share of workers with a job or actively looking for a job) was 62.8%, up from 62.6% in July. Experts feel that perhaps people’s COVID stimulus savings are running out to explain more workers entering the workforce. The labor-force is still well below its 63.4% level before the pandemic.
Home sales figures are released on the third week of the month by the California Association of Realtors and the National Association of Realtors. This is the July home sales data.
U.S. existing-home sales – The National Association of Realtors reported that existing-home sales totaled 4.07 million units on a seasonally adjusted annualized rate in July, down 16.6% from an annualized rate of 4.88 million in July 2022. The median price for a home in the U.S. in July was $406,700, up 1.9% from $399,000 one year ago. There was a 3.3-month supply of homes for sale in July, up from a 3.2-month supply last July. First-time buyers accounted for 30% of all sales. Investors and second-home purchases accounted for 16% of all sales. All-cash purchases accounted for 26% of all sales. Foreclosures and short sales accounted for 1% of all sales.
California existing-home sales – The California Association of Realtors reported that existing-home sales totaled 269,180 on a seasonally adjusted annualized basis in July. That marked the tenth straight month on sales dropping under 300,000 on an annualized basis. The number of sales is down approximately 40% from July 2021. Year-to-date the number of homes sold was down 30.3% from the first seven months of 2022. The statewide median price paid for a home in July was $832,390, up 0.2% from $830,870 last July. There was a 2.5-month supply of single-family homes for sale in July, down from a 3.1-month supply one year ago.
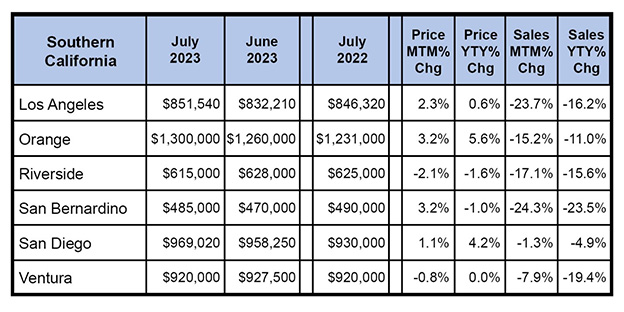
The graph below has sales data for Southern California by region. This was compiled by the California Association of Real Estate.


