Economic update for the week ending July 29, 2017 

Stock markets mixed this week – The Dow was up as corporate earnings of DOW companies are beating expectations. The Nasdaq and S&P were unchanged. The Dow Jones Industrial Average ended the week at 21,830.21, up from 21,580.07 last week. The S&P 500 closed the week at 2,472.10, unchanged from its close last week of 2,472.55. The NASDAQ closed the week at 6,374.78, almost unchanged from last week’s close of 6,387.75.  

Bond yields rise this week– The 10-year Treasury bond closed the week at 2.30%, up from 2.24% last week. The 30-year treasury yield ended the week at 2.89%, up from 2.81% last week. Mortgage rates follow treasury bond yields so we watch bond yields carefully.

Mortgage Rates lower this week– The July 27, 2017 Freddie Mac Primary Mortgage Survey reported that the 30-year fixed mortgage rate average was 3.92%, down from 3.96% last week. The 15-year fixed was 3.20%, down from 3.23% last week. The 5-year ARM was 3.18%, down from 3.21% last week. 

U.S. existing home sales drop in June, but still higher than 2016 levels – Prices continue to rise – The National Association of Realtors reported that existing home sales, which are completed transactions that include single-family homes, town-homes, condominiums, and co-ops, decreased 1.8 percent to a seasonally adjusted annual rate of 5.52 million in June from 5.62 million in May. Despite last month’s decline, June’s sales pace is 0.7% above a year ago, but is the second lowest of 2017 (February, 5.47 million). We are still on pace for either the most sales ever in the U.S. The median price for an existing-home in June was up 6.5% from June 2016. June marked the 64th straight month of year-over-year price gains. Total housing inventory at the end of June declined 7.1% from last June’s level. The number of homes for sale has fallen year-over-year for 25 consecutive months. Unsold inventory is at a 4.3-month supply at the current sales pace, which is down from 4.6 months a year ago. 

New home sales rise in June – The Commerce Department reported that sales of new homes rose 0.8% in June from May’s sales levels. Year over year new home sales are a staggering 9.1% higher than the number of new home sales last June. New home sales in the west increased 12.5% to the highest number of new home sales since July 2007. 

Have a great weekend!
Syd

Economic update for the week ending July 22, 2017

Stocks almost unchanged this week – In a calm week, the S&P and Nasdaq remained at record highs while the Dow was slightly lower than the record highs of last week. The Dow Jones Industrial Average ended the week at 21,580.07, down from 21,637.74 last week. The S&P 500 closed the week at 2,472.55, up from its close last week of 2,459.27. The NASDAQ closed the week at 6,387.75, up from last week’s close of 6,312.47. 

Bond yields drop this week – The 10-year Treasury bond closed the week at 2.24%, down from 2.33% last week. The 30-year treasury yield ended the week at 2.81%, down from 2.91% last week. Mortgage rates follow treasury bond yields so we watch bond yields carefully.

Mortgage rates lower this week week – The July 20, 2017 Freddie Mac Primary Mortgage Survey reported that the 30-year fixed mortgage rate average was 3.96%, down from 4.03% last week. The 15-year fixed was 3.23%, down from 3.29% last week. The 5-year ARM was 3.21%, down from 3.27% last week. 

L.A. County unemployment rate unchanged in June – The unemployment rate remained at a record low of 4.4% in June. A year ago, the unemployment rate stood at 5.2%. 

California existing home sales and prices up in June – The California Association of Realtors announced that sales of existing, single-family detached homes totaled a seasonally adjusted annualized rate of 443,150 units in June. The statewide sales figure represents what would be the total number of homes sold during 2017 if sales maintained the June pace throughout the year. It is adjusted to account for seasonal factors that typically influence home sales. The June figure was up 3.3% from the revised 428,890 level in May and up 2.4% compared with home sales in June 2016 of a revised 432,880. Year-to-date sales are running 3.2% ahead of last year’s pace.  

The statewide median price was up 0.9% from a revised $550,080 in May to reach $555,150 in June, and was 7.0% higher than the revised $518,830 recorded in June 2016. The median sales price is the point at which half of homes sold for more and half sold for less. 

Foreign home buyers set U.S. record – The National Association of Realtors announced that foreigners purchased 284,455 residential properties in the 12 months ending March 31, 2017. That’s an increase of about 34% from the same period one year ago. The dollar volume surged nearly 50% to $153 billion. That was a new record. Chinese nationals purchased $31.7 billion worth of residential properties, up from $27.3 billion one year earlier. The group with the largest increase was Canadians, who purchased $19 billion worth of residential properties, up from $8.9 billion in the 12 months ending March 31, 2016. It was a dramatic jump considering that the strong U.S. dollar makes properties more expensive. Foreign buyers spent $35 billion on California residential properties. That was up from $27 billion one year earlier. Asian buyers represented 71% of foreign buyers in California, up from 51% a year earlier. 

Economic update for the week ending July 15, 2017

Stock markets end week at record highs – The S&P and the Dow set records this week as stocks climbed Wednesday, Thursday and Friday. The start of second quarter earnings season began Friday. Earnings of companies in The S&P were up 15.3%. The rise was across the board fueled by several sectors. Energy stocks climbed as crude oil prices rose. Technology and healthcare companies saw modest gains. Retail rebounded after analysts upgraded the sector following encouraging news from Target and others. This calmed investors who brushed off a report that showed retail was weaker in June. Financials were also up as several big banks reported second quarter earnings that beat expectations. The Dow Jones Industrial Average ended the week at 21,637.74, up from 21,414.34 last week. The S&P 500 closed the week at 2,459.27 unchanged from its close last week of 2,425.18. The NASDAQ closed the week at 6,312.47 up from last week’s close of 6,153.08.

Bond yields drop this week- Federal Reserve chairwoman Janet Yellen spoke earlier in the week. In her comments it appeared that the Fed plans to slow down the pace of interest rate increases. The Fed has raised its benchmark rates three times since December. She also stated that the economy was healthy, but reiterated that inflation was well below the Fed’s target level. The 10-year Treasury bond closed the week at 2.33%, down from 2.39% last week. The 30-year treasury yield ended the week at 2.91%, down from 2.93% last week. Mortgage rates follow treasury bond yields so we watch bond yields carefully.

Mortgage Rates higher this week – The July 13, 2017 Freddie Mac Primary Mortgage Survey reported that the 30-year fixed mortgage rate average was 4.03%, up from 3.96% last week. The 15-year fixed was 3.29%, up from 3.22% last week. The 5-year ARM was 3.27%, up from 3.31% last week. Unfortunately, rates rose late in the week so next weeks rates will be higher. 

Consumer prices flat in June – U.S. Consumer prices slowed to a 1.6% growth rate for the 12 months ending June 30. This was down from an already stubborn inflation rate of 1.9% in May. The core inflation rate, which excludes food and energy was unchanged at 1.7%. Analysts expect that this low inflation rate will prompt the Fed to hold off on any interest rate hikes, at least for now. 

Have a great weekend! 
Syd

Economic update for the week ending July 7, 2017

Employers add 222,000 jobs in June – Hiring rebounded in June, according to The Bureau of Labor Statistics, as employers added 222,000 new jobs. Although the unemployment rate ticked up to 4.4% in June from 4.3% in May, a 16-year low, this was a solid report which beat expectations after a disappointing three months of job growth. The labor-force participation rate grew from 67.7% in May to 67.8% in June as more people entered the work force. Wages grew 0.2% in June from May and are up just 2.5% over the last 12 months. That’s well below average wage growth and still stumping experts. It’s highly unusual to have low unemployment without healthy wage growth. 

Stocks higher this week – Stocks rallied after Friday’s jobs report. After a lackluster week in which disappointing auto sales, weakness in “brick and mortar” retail, and pressure on tech firms, stocks rebounded as more workers than expected were hired in June. The Dow Jones Industrial Average ended the week at 21,414.34, up from 21,349.63 last week. The S&P 500 closed the week at 2,425.18, unchanged from its close last week of 2,423.41. The NASDAQ closed the week at 6,153.08, up from last week’s close of 6,140.42. 

Bond yields higher again this week– The 10-year Treasury bond closed the week at 2.39%, up from 2.31% last week. The 30-year treasury yield ended the week at 2.93%, up from 2.84% last week. Mortgage rates follow treasury bond yields so we watch bond yields carefully.

Mortgage Rates higher this week– The July 6, 2017 Freddie Mac Primary Mortgage Survey reported that the 30-year fixed mortgage rate average was 3.96%, up from 3.88% last week. The 15-year fixed was 3.22%, up from 3.18% last week. The 5year ARM was 3.21%, up from 3.18% last week. Unfortunately, rates rose late in the week so next weeks rates will be higher. 

Have a great weekend! 
Syd

Economic update for the week ending June 30, 2017

For the week ending June 31, 2017 – The Dow Jones Industrial Average ended the week at 21,349.63, down slightly from 21,394.76 last week. The S&P 500 closed the week at 2,423.41, down from its close last week of 2,438.30. The NASDAQ closed the week at 6,140.42, down from last week’s close of 6,265.25.

Bond yields up in last week of month – The 10-year Treasury bond closed the week at 2.31%, up from 2.15% last week. The 30-year treasury yield ended the week at 2.84%, up from 2.71% last week. Mortgage rates follow treasury bond yields so we watch bond yields carefully.

Mortgage Rates almost unchanged this week – The June 29, 2017, Freddie Mac Primary Mortgage Survey reported that the 30-year fixed mortgage rate average was 3.88%, almost unchanged from 3.90% last week. The 15-year fixed was 3.18%, almost unchanged from 3.17% last week. The 5-year ARM was 3.18%, also unchanged from 3.14% last week. Unfortunately, rates rose late in the week so next week’s rates will be higher.

Have a great holiday weekend!

Syd

Economic update for the week ending June 24, 2017

Stocks stable again this week – Hovering just above and below their all time highs, stocks ended the week pretty much unchanged for the third straight week. Energy stocks dropped as the price of oil plummeted to just under $43 per barrel, an 18-month low. Financial stocks rose after the Federal Reserve announced that all banks passed their annual stress test. The Dow Jones Industrial Average ended the week at 21,394.76, up slightly from 21,384.28 last week. The S&P 500 closed the week at 2,438.30, just above its close last week of 2,433.15. The NASDAQ closed the week at 6,265.25, up from last week’s close of 6,151.76

Bond yields – The 10-year Treasury bond closed the week at 2.15%, almost unchanged from 2.16% last week. The 30-year treasury yield ended the week at 2.71%, down from 2.78% last week. Mortgage rates follow treasury bond yields so we watch bond yields carefully.

Mortgage Rates remain at lowest levels of the year – The June 22, 2017 Freddie Mac Primary Mortgage Survey reported that the 30-year fixed mortgage rate average was 3.90%, almost unchanged from 3.91% last week. The 15-year fixed was 3.17%, almost unchanged from 3.18% last week. The 5-year ARM was 3.14%, also unchanged from 3.15% last week. 

California existing home sales numbers and prices accelerate in May – After a disappointing April, existing home sales bounced back in May. On a seasonally adjusted annualized rate, single family existing home sales totaled 430,460 in May. That was a 5.4% increase from April and a 2.6% increase from last May. The statewide median price paid for a home was $550,200, up 2.3% from April and up 5.8% from May 2016. 

At a regional level, the Los Angeles metro region had a 6.9% increase in sales. Existing home sales include all detached and attached homes, which include single family, town-homes, condominiums, and co-ops. 

C.A.R.’s Unsold Inventory Index fell from 3.3 months in April to 2.9 months in May. The index measures the number of months needed to sell the supply of homes on the market. The index stood at 3.4 months in May 2016.

With home inventory at record low levels, prices will continue to rise. When you have more buyers than sellers that is what happens. Earlier in the year I predicted a 10% rise in the median price. I believe we are on track for that. The number of sales at 430,000, which would be much higher if more sellers listed, is the highest level in many years. Many sellers worry that they will not find anything to buy after they sell. With 430,000 sales in California there are plenty of homes selling. Unfortunately, as buyers they just need to act fast and chose from fewer homes. We can’t have it both ways. If homes sat on the market and were difficult to sell there would be plenty of homes to chose from when their home sold. In this market where homes are selling there are fewer homes to chose from and they need to act fast. Every buyer wishes, or should wish, that they bought a home they passed on just months ago as those homes are much more expensive now. So many of our clients have been “priced out” of neighborhoods they were able to afford just months ago. Especially people that hoped to “move up” to a more expensive home. 

Have a great weekend!
Syd

Economic update for the week ending June 17, 2017

Stocks mixed for the week – As expected, The Federal Reserve increased its Federal Funds and Discount Rate by another .25%. It’s 3rd increase in 6 months. The rate is still at a historically low level of just 1%. The raise shows that The Fed feels the economy is strong. At the same time, a key Fed inflation report showed that inflation was just 1.5%. That was well below the 2% target level set by the Fed. Another report showed retail sales were slowing. Oil also dropped this week. Despite the stagnation in inflation and wage growth, the Fed cited that being near full unemployment a rate increase was warranted. This caused interest rates paid on savings accounts to rise, the prime rate to rise, and short term adjustable rate mortgages to rise. The low inflation report, slowing retail sales, and falling oil prices caused long term mortgage rates and treasury yields to drop. The Dow Jones Industrial Average ended the week at 21,384.28 l, up from 21,271.97 last week. The S&P 500 closed the week at 2,433.15, just above its close last week of 2,431.77. The NASDAQ closed the week at 6,151.76, down from last week’s close of 6,207.93.

Bond yields drop as Fed raises overnight rates – Even though the Fed increased overnight rates for the third time since December, long term rates have dropped to the lowest level in 7 months. Since the Fed’s first increase in December 2015 the Fed’s overnight rates have gone from 0% to 1%, yet the 10-year treasury bond is .15% lower than it was before that first increase. That is because inflation is so tame. The 10-year Treasury bond closed the week at 2.16%, down from 2.21%, last week. The 30-year treasury yield ended the week at 2.78%, down from 2.86% last week. Mortgage rates follow treasury bond yields so we watch bond yields carefully.

Mortgage Rates down this week – The June 15, 2017 Freddie Mac Primary Mortgage Survey reported that the 30-year fixed mortgage rate average was 3.91%, almost unchanged from 3.89% last week. The 15-year fixed was 3.18%, almost unchanged from 3.16% last week. The 5-year ARM was 3.15%, up slightly from 3.11% last week. Long term fixed rates dropped after The Federal Reserve raised overnight rates on Wednesday so next week’s rates should be a little lower.

California jobless rate lowest since 2000 – The Employment Development Department reported that the unemployment rate in California has dropped to 4.7% in May. Los Angeles County fared even better. The unemployment rate in the county fell to 4.4%.

The California Association of Realtors and National Association of Realtors have not released May sales data yet. Those will be out and included in my report next week.

Have a great weekend!
Syd

Economic update for the week ending October 29, 2016

img_1994-3.jpg

Stocks mixed for the week – While a better than expected U.S. 3rd quarter economic growth figure was released, other news dragged down stocks this week. Mixed quarterly results came in for the third quarter. While financial and health care companies reported better than expected profits, energy companies had disappointing results. Exxon took a huge write down of nearly 20% on new oil reserves based on lower oil prices. Oil dropped as well after several weeks of gains. Fears of higher interest rates weighed heavily on stocks and bonds as investors felt that the 3rd quarter economic growth, lower unemployment, and other data would cause The Federal Reserve raise its key interest rates at the December meeting. The Dow Jones Industrial Average closed the week at 18,161.19, up from 18,145.71 last Friday. The S&P 500 closed the week at 2,126.42, down from 2,141.16 last week. The NASDAQ closed the week at 5,190.10, down from last week’s close of 5,257.40.

U.S. Treasury Bond yields rise on better economic news this week – The 10 year U.S. Treasury Bond yield closed the week at 1.86%, up from 1.74% last Friday. The 30-year U.S. Treasury Bond closed at 2.62%, up from 2.48% last week. Mortgage rates follow bond yields so we watch bond yields closely.

Mortgage rates just slightly lower this week – The Freddie Mac Primary Mortgage Survey released on October 27, 2016 showed that average mortgage rates from lenders surveyed for the most popular mortgage products were as follows: The 30-year fixed rate average was 3.47%. The 15-year fixed average rate was 2.78%. The 5/1 ARM average rate was 2.84%. Rates rose late in the week, so rates will definitely be higher in next week’s survey.

California employers add 30,000 new jobs in September – The Employment Development Department reported that California added 30,000 net new jobs in September. The state’s unemployment rate held steady at 5.5%, as more workers entered the workforce. Employers in Los Angeles County increased their payrolls by 19,400 employees. The unemployment rate in Los Angeles County actually increased slightly to 5% as more workers began the job search. Year over year the unemployment rate is down significantly from 6.2% last September. The labor force now has reached 5.2 million people which is the largest it’s been in 15 years in L.A. County.

American economy grew at 2.9% annualized rate in 3rd quarter – The Commerce Department reported that the U.S. economy grew at an annualized rate of 2.9% in the 3rd quarter toping analyst’s expectations of a 2.5% increase. While this was the best quarter in 2 years, it followed just a 1.1% increase for the first 2 quarters (January to June), the slowest first half since 2011.

Existing pending U.S. home sales up in September – U.S. Pending home sales were higher in September after dropping in August according to The National Association of Realtors. The pending home sale index, a forward indicator of future closed sales is based on new contract signings. The number of new contracts signed to purchase an existing home in The U.S. increased 1.5% from August’s figures. It was also up 2.4% from September 2015. It has now risen on a year over year basis for 22 out of the last 25 months.

Existing home pending sales rise in California – The California Association of Realtors released their pending home sales report which showed both month over month gains, and year over year gains in the number of pending sales. Statewide pending home sales were up 5.3% in September from August’s seasonally adjusted level and up 10.5% from last September. Pending home sales include new contracts signed for existing single family attached and detached homes. September’s pending home sales in the Southern California region were down 4.6% from August’s figures, but up 15.3% from last September.

Have a great weekend!

Syd

Economic Update For The Week Ending November 22, 2014

Economic update for the week ending November 22, 2014

RR_Logo_Black_BOLD1-300x300 


Another record-breaking week for US stocks  – The US stock markets posted their fifth straight week of gains with new highs, buoyed by positive economic news from Europe and China, and positive job gains at home. The Dow Jones Industrial Average closed the week at 17,810.06, up from last weeks closes of 17,634.74. The S&P 500 closed Friday at 2063.50, up from last Friday’s close of 2039.82. The NASDAQ closed at 4712.97; above last weeks close of 4688.54. The People’s Bank of China made a surprise interest rate cut on Friday, its first cut in 2 years. Mario Draghi, the president of the European Central bank said that the central bank is prepared to step up efforts to give the Eurozone a much-needed boost. Both of these announcements led to gains in worldwide markets.


Consumer Price Index- The Bureau of Labor Statics reported that prices remained flat in October. The year over year CPI increase showed the inflation rate at 1.7%, well below the Federal Reserve’s target rate for a healthy economy. The Fed released its minutes on November 19 from its October meeting. In the minutes it cautioned of “evidence of a possible downward shift in long-term inflation expectations.”


Treasury Bond Rates – Yield Curve Flattens to a 2 year low – The 10 year Treasury bond closed the week at 2.31% almost unchanged from last Friday’s close of 2.32%. The 30 year treasury yield (rate) was 3.02%, down slightly from last week’s 3.04%. The yield curve between the 2 year treasury and the 30 year treasury, which is the difference between the rates (spread), reached a 2 year low with a spread of 2.51%. It was 3.639% on November 20, 2013. This is due to inflation being below the Federal Reserve’s target rate. Expectations of inflation push up long-term rates, low inflation pulls them down. US bond yields are lower than many foreign countries making them very enticing to foreign investors. For example our 10 bond year yields 1.54% more than German 10 year bonds.


Mortgage Rates – The Freddie Mac Primary Mortgage Survey reported that the 30 year fixed mortgage rate average for the week was 3.99% down from 4.01% last week. The 15 year fixed was also down at 3.17% from 3.2% last week.


California gains 41,500 non-farm jobs – The California Employment Development Department reported that non-farm payrolls increased in October by 41,500 jobs. This figure eclipsed the September gain of 14,200 jobs and was way above expectations, yet the California unemployment rate remained unchanged at 7.3%.  California recorded the highest monthly job gains in the country in October. The total job gains, according to the EDD, since the recovery began in February 2010 has been 1,446,600. The year over year increase was 319,500 jobs, a 2.1% increase. Of that increase Professional and business services posted the largest numerical increase adding 106,000 jobs, up 4.5%. Construction posted the largest percentage increase of 5.3% for the year, adding 34,000 jobs. Financial activities were the only sector to lose jobs and showed 4,700 fewer jobs than one year ago, a 0.6% decrease.


California Association of Realtors – CAR released its October sales figures last week. They stated that despite the lowest mortgage rates in 18 months sales in October remained unchanged from September. October sales were down 1.9% from the number of sales in October 2013 marking one full year in which the number of sales was below 400,000 units. The Median price decreased by 2.3% in October to $450,620 from September’s $461,370. The median price is the point in which half the homes sell for more and half the homes sell for less. They also reported that the higher priced markets remained stronger than other markets.  Inventory levels slipped to a 3.8 month supply from a 4.2 month supply in September. There was a 3.3 month supply in October 2013. It must be noted that CAR figures do not include sales that were not reported to a MLS system.


Lower rates have led to more buyer demand. It seems like the number of multiple offer situations have increased. I would not be surprised to see month over month prices to show an increase after being flat the past few months. It takes a while for escrow to close so I am looking for this increase to be reported in the December and January closings. We will wait and see!


Have a great weekend!

Syd

Economic Update For The Week Ending February 21, 2014 with Syd Leibovitch

EconomicUpdate2212014Stocks were mixed this holiday-shortened week responding to a mixed bag of news. Inflation reports show inflation remains low. In January, overall prices rose 1.6%  from a year ago. Prices of most commodities rose modestly while the shelter index was up at 2.6%  compared to a year ago because rents are rising.

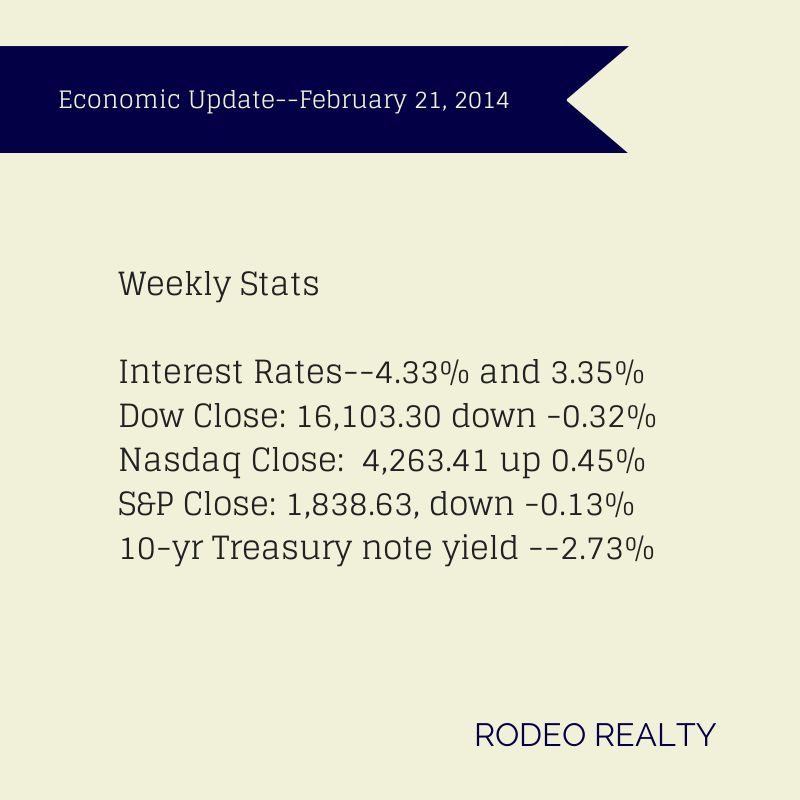
The Dow closed out the week at 16,103.30 down -0.32%  from last week’s close of 16,154.39. The Nasdaq was up, ending the week at 4,263.41 up 0.45% from last week’s 4,244.03 close. The S&P 500 was down very slightly, closing the week at 1,838.63, down -0.13% from last week’s 1,838.63 close.

The  10-year Treasury note yield rate was down slightly to 2.73% after ending last week at 2.75%. It was 1.99% a year ago.

Mortgage Interest rates rose slightly this week. The Freddie Mac Weekly Primary Mortgage Market Survey showed that the 30-year-fixed rate up to 4.33% from 4.28% last week.  The 15-year-fixed inched up to 3.35% from last week’s 3.33%. A year ago the 30-year fixed was at 3.56% and the 15-year was at 2.77%. Interest rates on loans over $417,000 are around 4.625% for 30 year fixed and 3.625% on 15 year fixed.

Low inventory continues to have a constraining effect on California home sales. The California Association of Realtors® reported that closed escrow sales of existing, single-family detached homes in California totaled a seasonally adjusted annualized rate of 363,640 units in January, marking the third straight month that sales were below the 400,000 level and the sixth straight decline on a year-over-year basis. Sales in January were up 0.3% from a revised 362,430 in December but were down -13.8%  from a revised 421,780 in January 2013. Inventory at the higher end of the market, priced $1 million and higher did increase 11.1% from last year. The statewide median price of an existing, single-family detached home fell -6.2%  from December’s revised median price of $438,090 to $410,990 in January.  January’s price was 22.1% higher than the revised $336,650 recorded in January 2013, marking 23 consecutive months of year-over-year price increases and the 19th straight month of double-digit annual increases. The available supply of existing, single-family detached homes for sale rose in January to 4.3 months, up from December’s Unsold Inventory Index of 3 months. The index was 3.5 months in January 2013.  The median number of days it took to sell a single-family home also increased to 44.3 days in January, up from 40.2 days in December and from a revised 36.7 days in January 2013.

In Los Angeles County alone, the median sold price of existing homes was down –3.7% in January from December’s $439,830 to $423,570 which is up 21.1% from January 2013’s $349,720 median price. Total sales were down– 21.2% month over month and down -13.3% from January 2013.

Data from the National Association of Realtors® showed that existing-home sales fell by -5.1%from December to January to a seasonally adjusted annual rate of 4.62 million the lowest level since July 2012. Home sales were also down -5.1% year over year. The cold weather, low inventory, and rising mortgage rates are cited as potential reasons for the lower numbers. Inventory improved modestly, up 2.2% month over month to 1.9 million homes and up 7.3% from January 2013. The current inventory supply rate is now 4.9 months, up from 4.6 months in December and 4.4 months a year ago. The median existing home price for all housing types nationwide in January was $188,900, up 10.7% from January 2013. The median time on market for all homes was 67 days in January, down from 72 days in December and 31%  of homes sold in January were on the market for less than a month. Existing-home sales in the West dropped -7.3%  to a pace of 1.01 million in January, and are -13.7% below a year ago. The median price for the West was $273,500, up 14.6% from January 2013.

The latest foreclosure data from RealtyTrac shows that one in every 1,058 U.S. homes received a foreclosure filing in January. Foreclosure filings are down -18% from January 2013 but up 8% from December 2013. The rise in foreclosure activity was caused by a surge in starts, properties just entering foreclosure, as well as scheduled foreclosure auctions. The report did show that foreclosure starts in California actually rose 57% from a year ago after 17 consecutive months of annual decreases.

The extreme weather that has hammered much of the country seems to have also impacted homebuilder confidence. The National Association of Home Builders/Wells Fargo Builder Sentiment Index is now 46, down from January’s 56 reading and the lowest level since May. Economists had been predicting a number similar to the one they saw in January. Generally a reading below 50 indicates that more builders see sales conditions as poor rather than good. Builders’ prediction for sales over the next six months also fell by six points to 54.

U.S. housing starts saw their biggest drop in nearly three years last month. The U.S. Census Bureau and the Department of Housing and Urban Development reported that single-housing family starts were down -16% in January to a seasonally-adjusted annual rate of 880,000 units below economists’ predictions of 950,000. This was attributed to the unusually cold weather gripping much of the country and in fact in the hard-hit Midwest, starts were down a record -67.7%.  Groundbreaking for single-family homes, the largest segment of the market, fell 15.9 percent to a 573,000-unit pace in January, the lowest level since August 2012. Permits to build homes were down by -5.4% in January, the largest drop in since June.

The National Housing Trend Report from realtor.com® showed that the median list price for January rose 8.3% compared to last year but only up 0.1% from the previous month. The number of properties for sale was up 3.1% for the year but down -3.3% from the previous month. The median age of inventory was essentially unchanged. For the Los Angeles-Long Beach MSA the median price was $449,000 up 25.1% from a year ago but down -0.20% from the previous month. The amount of total listings was 18,600 up 3.40% from the previous year and up 5.10% from the previous month. The median age of inventory was 74 days, down -5.1% from the previous year and down -1.3% from the previous month.

We are heading into the selling season which will be a welcome relief when it comes to real estate related data. Expect to see the month over month indicators pick up after March! Not only do they pick up at that time every year, we are beginning to see the pick up in the marketplace.

While inventory levels are still near record lows we are beginning to see many more homes listed in many of our markets. That alone should increase the number of sales as we still see stronger demand than inventory supply which is evident by the high number of multiple offers. Obviously, not all homes are getting multiple offers, there is a limit to how high a home can be priced. Homes that are not well priced are sitting on the market.