Economic update for the week ending June 24, 2017

Stocks stable again this week – Hovering just above and below their all time highs, stocks ended the week pretty much unchanged for the third straight week. Energy stocks dropped as the price of oil plummeted to just under $43 per barrel, an 18-month low. Financial stocks rose after the Federal Reserve announced that all banks passed their annual stress test. The Dow Jones Industrial Average ended the week at 21,394.76, up slightly from 21,384.28 last week. The S&P 500 closed the week at 2,438.30, just above its close last week of 2,433.15. The NASDAQ closed the week at 6,265.25, up from last week’s close of 6,151.76

Bond yields – The 10-year Treasury bond closed the week at 2.15%, almost unchanged from 2.16% last week. The 30-year treasury yield ended the week at 2.71%, down from 2.78% last week. Mortgage rates follow treasury bond yields so we watch bond yields carefully.

Mortgage Rates remain at lowest levels of the year – The June 22, 2017 Freddie Mac Primary Mortgage Survey reported that the 30-year fixed mortgage rate average was 3.90%, almost unchanged from 3.91% last week. The 15-year fixed was 3.17%, almost unchanged from 3.18% last week. The 5-year ARM was 3.14%, also unchanged from 3.15% last week. 

California existing home sales numbers and prices accelerate in May – After a disappointing April, existing home sales bounced back in May. On a seasonally adjusted annualized rate, single family existing home sales totaled 430,460 in May. That was a 5.4% increase from April and a 2.6% increase from last May. The statewide median price paid for a home was $550,200, up 2.3% from April and up 5.8% from May 2016. 

At a regional level, the Los Angeles metro region had a 6.9% increase in sales. Existing home sales include all detached and attached homes, which include single family, town-homes, condominiums, and co-ops. 

C.A.R.’s Unsold Inventory Index fell from 3.3 months in April to 2.9 months in May. The index measures the number of months needed to sell the supply of homes on the market. The index stood at 3.4 months in May 2016.

With home inventory at record low levels, prices will continue to rise. When you have more buyers than sellers that is what happens. Earlier in the year I predicted a 10% rise in the median price. I believe we are on track for that. The number of sales at 430,000, which would be much higher if more sellers listed, is the highest level in many years. Many sellers worry that they will not find anything to buy after they sell. With 430,000 sales in California there are plenty of homes selling. Unfortunately, as buyers they just need to act fast and chose from fewer homes. We can’t have it both ways. If homes sat on the market and were difficult to sell there would be plenty of homes to chose from when their home sold. In this market where homes are selling there are fewer homes to chose from and they need to act fast. Every buyer wishes, or should wish, that they bought a home they passed on just months ago as those homes are much more expensive now. So many of our clients have been “priced out” of neighborhoods they were able to afford just months ago. Especially people that hoped to “move up” to a more expensive home. 

Have a great weekend!
Syd

Economic update for the week ending June 17, 2017

Stocks mixed for the week – As expected, The Federal Reserve increased its Federal Funds and Discount Rate by another .25%. It’s 3rd increase in 6 months. The rate is still at a historically low level of just 1%. The raise shows that The Fed feels the economy is strong. At the same time, a key Fed inflation report showed that inflation was just 1.5%. That was well below the 2% target level set by the Fed. Another report showed retail sales were slowing. Oil also dropped this week. Despite the stagnation in inflation and wage growth, the Fed cited that being near full unemployment a rate increase was warranted. This caused interest rates paid on savings accounts to rise, the prime rate to rise, and short term adjustable rate mortgages to rise. The low inflation report, slowing retail sales, and falling oil prices caused long term mortgage rates and treasury yields to drop. The Dow Jones Industrial Average ended the week at 21,384.28 l, up from 21,271.97 last week. The S&P 500 closed the week at 2,433.15, just above its close last week of 2,431.77. The NASDAQ closed the week at 6,151.76, down from last week’s close of 6,207.93.

Bond yields drop as Fed raises overnight rates – Even though the Fed increased overnight rates for the third time since December, long term rates have dropped to the lowest level in 7 months. Since the Fed’s first increase in December 2015 the Fed’s overnight rates have gone from 0% to 1%, yet the 10-year treasury bond is .15% lower than it was before that first increase. That is because inflation is so tame. The 10-year Treasury bond closed the week at 2.16%, down from 2.21%, last week. The 30-year treasury yield ended the week at 2.78%, down from 2.86% last week. Mortgage rates follow treasury bond yields so we watch bond yields carefully.

Mortgage Rates down this week – The June 15, 2017 Freddie Mac Primary Mortgage Survey reported that the 30-year fixed mortgage rate average was 3.91%, almost unchanged from 3.89% last week. The 15-year fixed was 3.18%, almost unchanged from 3.16% last week. The 5-year ARM was 3.15%, up slightly from 3.11% last week. Long term fixed rates dropped after The Federal Reserve raised overnight rates on Wednesday so next week’s rates should be a little lower.

California jobless rate lowest since 2000 – The Employment Development Department reported that the unemployment rate in California has dropped to 4.7% in May. Los Angeles County fared even better. The unemployment rate in the county fell to 4.4%.

The California Association of Realtors and National Association of Realtors have not released May sales data yet. Those will be out and included in my report next week.

Have a great weekend!
Syd

Economic update for the week ending October 29, 2016

img_1994-3.jpg

Stocks mixed for the week – While a better than expected U.S. 3rd quarter economic growth figure was released, other news dragged down stocks this week. Mixed quarterly results came in for the third quarter. While financial and health care companies reported better than expected profits, energy companies had disappointing results. Exxon took a huge write down of nearly 20% on new oil reserves based on lower oil prices. Oil dropped as well after several weeks of gains. Fears of higher interest rates weighed heavily on stocks and bonds as investors felt that the 3rd quarter economic growth, lower unemployment, and other data would cause The Federal Reserve raise its key interest rates at the December meeting. The Dow Jones Industrial Average closed the week at 18,161.19, up from 18,145.71 last Friday. The S&P 500 closed the week at 2,126.42, down from 2,141.16 last week. The NASDAQ closed the week at 5,190.10, down from last week’s close of 5,257.40.

U.S. Treasury Bond yields rise on better economic news this week – The 10 year U.S. Treasury Bond yield closed the week at 1.86%, up from 1.74% last Friday. The 30-year U.S. Treasury Bond closed at 2.62%, up from 2.48% last week. Mortgage rates follow bond yields so we watch bond yields closely.

Mortgage rates just slightly lower this week – The Freddie Mac Primary Mortgage Survey released on October 27, 2016 showed that average mortgage rates from lenders surveyed for the most popular mortgage products were as follows: The 30-year fixed rate average was 3.47%. The 15-year fixed average rate was 2.78%. The 5/1 ARM average rate was 2.84%. Rates rose late in the week, so rates will definitely be higher in next week’s survey.

California employers add 30,000 new jobs in September – The Employment Development Department reported that California added 30,000 net new jobs in September. The state’s unemployment rate held steady at 5.5%, as more workers entered the workforce. Employers in Los Angeles County increased their payrolls by 19,400 employees. The unemployment rate in Los Angeles County actually increased slightly to 5% as more workers began the job search. Year over year the unemployment rate is down significantly from 6.2% last September. The labor force now has reached 5.2 million people which is the largest it’s been in 15 years in L.A. County.

American economy grew at 2.9% annualized rate in 3rd quarter – The Commerce Department reported that the U.S. economy grew at an annualized rate of 2.9% in the 3rd quarter toping analyst’s expectations of a 2.5% increase. While this was the best quarter in 2 years, it followed just a 1.1% increase for the first 2 quarters (January to June), the slowest first half since 2011.

Existing pending U.S. home sales up in September – U.S. Pending home sales were higher in September after dropping in August according to The National Association of Realtors. The pending home sale index, a forward indicator of future closed sales is based on new contract signings. The number of new contracts signed to purchase an existing home in The U.S. increased 1.5% from August’s figures. It was also up 2.4% from September 2015. It has now risen on a year over year basis for 22 out of the last 25 months.

Existing home pending sales rise in California – The California Association of Realtors released their pending home sales report which showed both month over month gains, and year over year gains in the number of pending sales. Statewide pending home sales were up 5.3% in September from August’s seasonally adjusted level and up 10.5% from last September. Pending home sales include new contracts signed for existing single family attached and detached homes. September’s pending home sales in the Southern California region were down 4.6% from August’s figures, but up 15.3% from last September.

Have a great weekend!

Syd

Economic Update For The Week Ending November 22, 2014

Economic update for the week ending November 22, 2014

RR_Logo_Black_BOLD1-300x300 


Another record-breaking week for US stocks  – The US stock markets posted their fifth straight week of gains with new highs, buoyed by positive economic news from Europe and China, and positive job gains at home. The Dow Jones Industrial Average closed the week at 17,810.06, up from last weeks closes of 17,634.74. The S&P 500 closed Friday at 2063.50, up from last Friday’s close of 2039.82. The NASDAQ closed at 4712.97; above last weeks close of 4688.54. The People’s Bank of China made a surprise interest rate cut on Friday, its first cut in 2 years. Mario Draghi, the president of the European Central bank said that the central bank is prepared to step up efforts to give the Eurozone a much-needed boost. Both of these announcements led to gains in worldwide markets.


Consumer Price Index- The Bureau of Labor Statics reported that prices remained flat in October. The year over year CPI increase showed the inflation rate at 1.7%, well below the Federal Reserve’s target rate for a healthy economy. The Fed released its minutes on November 19 from its October meeting. In the minutes it cautioned of “evidence of a possible downward shift in long-term inflation expectations.”


Treasury Bond Rates – Yield Curve Flattens to a 2 year low – The 10 year Treasury bond closed the week at 2.31% almost unchanged from last Friday’s close of 2.32%. The 30 year treasury yield (rate) was 3.02%, down slightly from last week’s 3.04%. The yield curve between the 2 year treasury and the 30 year treasury, which is the difference between the rates (spread), reached a 2 year low with a spread of 2.51%. It was 3.639% on November 20, 2013. This is due to inflation being below the Federal Reserve’s target rate. Expectations of inflation push up long-term rates, low inflation pulls them down. US bond yields are lower than many foreign countries making them very enticing to foreign investors. For example our 10 bond year yields 1.54% more than German 10 year bonds.


Mortgage Rates – The Freddie Mac Primary Mortgage Survey reported that the 30 year fixed mortgage rate average for the week was 3.99% down from 4.01% last week. The 15 year fixed was also down at 3.17% from 3.2% last week.


California gains 41,500 non-farm jobs – The California Employment Development Department reported that non-farm payrolls increased in October by 41,500 jobs. This figure eclipsed the September gain of 14,200 jobs and was way above expectations, yet the California unemployment rate remained unchanged at 7.3%.  California recorded the highest monthly job gains in the country in October. The total job gains, according to the EDD, since the recovery began in February 2010 has been 1,446,600. The year over year increase was 319,500 jobs, a 2.1% increase. Of that increase Professional and business services posted the largest numerical increase adding 106,000 jobs, up 4.5%. Construction posted the largest percentage increase of 5.3% for the year, adding 34,000 jobs. Financial activities were the only sector to lose jobs and showed 4,700 fewer jobs than one year ago, a 0.6% decrease.


California Association of Realtors – CAR released its October sales figures last week. They stated that despite the lowest mortgage rates in 18 months sales in October remained unchanged from September. October sales were down 1.9% from the number of sales in October 2013 marking one full year in which the number of sales was below 400,000 units. The Median price decreased by 2.3% in October to $450,620 from September’s $461,370. The median price is the point in which half the homes sell for more and half the homes sell for less. They also reported that the higher priced markets remained stronger than other markets.  Inventory levels slipped to a 3.8 month supply from a 4.2 month supply in September. There was a 3.3 month supply in October 2013. It must be noted that CAR figures do not include sales that were not reported to a MLS system.


Lower rates have led to more buyer demand. It seems like the number of multiple offer situations have increased. I would not be surprised to see month over month prices to show an increase after being flat the past few months. It takes a while for escrow to close so I am looking for this increase to be reported in the December and January closings. We will wait and see!


Have a great weekend!

Syd

Economic Update For The Week Ending February 21, 2014 with Syd Leibovitch

EconomicUpdate2212014Stocks were mixed this holiday-shortened week responding to a mixed bag of news. Inflation reports show inflation remains low. In January, overall prices rose 1.6%  from a year ago. Prices of most commodities rose modestly while the shelter index was up at 2.6%  compared to a year ago because rents are rising.

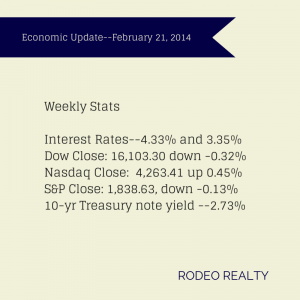
The Dow closed out the week at 16,103.30 down -0.32%  from last week’s close of 16,154.39. The Nasdaq was up, ending the week at 4,263.41 up 0.45% from last week’s 4,244.03 close. The S&P 500 was down very slightly, closing the week at 1,838.63, down -0.13% from last week’s 1,838.63 close.

The  10-year Treasury note yield rate was down slightly to 2.73% after ending last week at 2.75%. It was 1.99% a year ago.

Mortgage Interest rates rose slightly this week. The Freddie Mac Weekly Primary Mortgage Market Survey showed that the 30-year-fixed rate up to 4.33% from 4.28% last week.  The 15-year-fixed inched up to 3.35% from last week’s 3.33%. A year ago the 30-year fixed was at 3.56% and the 15-year was at 2.77%. Interest rates on loans over $417,000 are around 4.625% for 30 year fixed and 3.625% on 15 year fixed.

Low inventory continues to have a constraining effect on California home sales. The California Association of Realtors® reported that closed escrow sales of existing, single-family detached homes in California totaled a seasonally adjusted annualized rate of 363,640 units in January, marking the third straight month that sales were below the 400,000 level and the sixth straight decline on a year-over-year basis. Sales in January were up 0.3% from a revised 362,430 in December but were down -13.8%  from a revised 421,780 in January 2013. Inventory at the higher end of the market, priced $1 million and higher did increase 11.1% from last year. The statewide median price of an existing, single-family detached home fell -6.2%  from December’s revised median price of $438,090 to $410,990 in January.  January’s price was 22.1% higher than the revised $336,650 recorded in January 2013, marking 23 consecutive months of year-over-year price increases and the 19th straight month of double-digit annual increases. The available supply of existing, single-family detached homes for sale rose in January to 4.3 months, up from December’s Unsold Inventory Index of 3 months. The index was 3.5 months in January 2013.  The median number of days it took to sell a single-family home also increased to 44.3 days in January, up from 40.2 days in December and from a revised 36.7 days in January 2013.

In Los Angeles County alone, the median sold price of existing homes was down –3.7% in January from December’s $439,830 to $423,570 which is up 21.1% from January 2013’s $349,720 median price. Total sales were down– 21.2% month over month and down -13.3% from January 2013.

Data from the National Association of Realtors® showed that existing-home sales fell by -5.1%from December to January to a seasonally adjusted annual rate of 4.62 million the lowest level since July 2012. Home sales were also down -5.1% year over year. The cold weather, low inventory, and rising mortgage rates are cited as potential reasons for the lower numbers. Inventory improved modestly, up 2.2% month over month to 1.9 million homes and up 7.3% from January 2013. The current inventory supply rate is now 4.9 months, up from 4.6 months in December and 4.4 months a year ago. The median existing home price for all housing types nationwide in January was $188,900, up 10.7% from January 2013. The median time on market for all homes was 67 days in January, down from 72 days in December and 31%  of homes sold in January were on the market for less than a month. Existing-home sales in the West dropped -7.3%  to a pace of 1.01 million in January, and are -13.7% below a year ago. The median price for the West was $273,500, up 14.6% from January 2013.

The latest foreclosure data from RealtyTrac shows that one in every 1,058 U.S. homes received a foreclosure filing in January. Foreclosure filings are down -18% from January 2013 but up 8% from December 2013. The rise in foreclosure activity was caused by a surge in starts, properties just entering foreclosure, as well as scheduled foreclosure auctions. The report did show that foreclosure starts in California actually rose 57% from a year ago after 17 consecutive months of annual decreases.

The extreme weather that has hammered much of the country seems to have also impacted homebuilder confidence. The National Association of Home Builders/Wells Fargo Builder Sentiment Index is now 46, down from January’s 56 reading and the lowest level since May. Economists had been predicting a number similar to the one they saw in January. Generally a reading below 50 indicates that more builders see sales conditions as poor rather than good. Builders’ prediction for sales over the next six months also fell by six points to 54.

U.S. housing starts saw their biggest drop in nearly three years last month. The U.S. Census Bureau and the Department of Housing and Urban Development reported that single-housing family starts were down -16% in January to a seasonally-adjusted annual rate of 880,000 units below economists’ predictions of 950,000. This was attributed to the unusually cold weather gripping much of the country and in fact in the hard-hit Midwest, starts were down a record -67.7%.  Groundbreaking for single-family homes, the largest segment of the market, fell 15.9 percent to a 573,000-unit pace in January, the lowest level since August 2012. Permits to build homes were down by -5.4% in January, the largest drop in since June.

The National Housing Trend Report from realtor.com® showed that the median list price for January rose 8.3% compared to last year but only up 0.1% from the previous month. The number of properties for sale was up 3.1% for the year but down -3.3% from the previous month. The median age of inventory was essentially unchanged. For the Los Angeles-Long Beach MSA the median price was $449,000 up 25.1% from a year ago but down -0.20% from the previous month. The amount of total listings was 18,600 up 3.40% from the previous year and up 5.10% from the previous month. The median age of inventory was 74 days, down -5.1% from the previous year and down -1.3% from the previous month.

We are heading into the selling season which will be a welcome relief when it comes to real estate related data. Expect to see the month over month indicators pick up after March! Not only do they pick up at that time every year, we are beginning to see the pick up in the marketplace.

While inventory levels are still near record lows we are beginning to see many more homes listed in many of our markets. That alone should increase the number of sales as we still see stronger demand than inventory supply which is evident by the high number of multiple offers. Obviously, not all homes are getting multiple offers, there is a limit to how high a home can be priced. Homes that are not well priced are sitting on the market.

Economic Update For The Week Ending February 14, 2014 With Syd Leibovitch

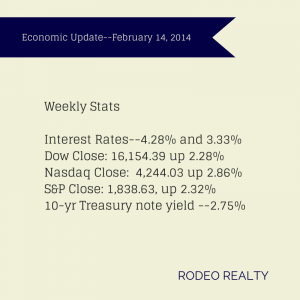
economicupdate0214This week the stock market saw another week of positive territory with strong gains seen in all three indices as investors took into account bad weather as an excuse for some soft economic data. While U.S. export prices rose 0.2%  in January, the third straight monthly increase, factory production fell 0.8% in January, the biggest drop in more than 4-1/2 years. The Dow closed out the week at 16,154.39 up 2.28%  from last week’s close of 15,794.08. The Nasdaq was also up, ending the week at 4,244.03 up 2.86% from last week’s 4,125.86 close. The S&P 500 ended the week at 1,838.63, up 2.32% from last week’s 1,797.02 close.

The  10-year Treasury note yield rate rose slightly to 2.75% after ending last week at 2.71%. It was 2.00% a year ago.

Interest rates saw a slight rise this week after several lower weeks. The Freddie Mac Weekly Primary Mortgage Market Survey showed that the 30-year-fixed rate up to 4.28% from 4.23% last week.  The 15-year-fixed stayed solid at 3.33% the same as last week’s 3.33%. A year ago the 30-year fixed was at 3.53% and the 15-year was at 2.77%.


The latest quarterly report from the National Association of Realtors® shows that the

median existing single-family home price increased in 73% of measured markets, with 119 out of 164 metropolitan statistical areas (MSAs) showing gains based on closings in the fourth quarter compared with the fourth quarter of 2012. Forty-two areas, 26 % had double-digit increases. The national median existing single-family home price was $196,900 in the fourth quarter, up 10.1%  from $178,900 in the fourth quarter of 2012. In the third quarter the median price rose 12.5% from a year earlier. In the West, existing-home sales dropped -12.7% in the fourth quarter, and are -8.1% below a year ago. Lack of inventory remains a concern. The median existing single-family home price in the West jumped 15.5% to $286,200 in the fourth quarter from the fourth quarter of 2012.


Credit reporting agency TransUnion released a report showing that the amount of late payments on home loans has hit the lowest level in more than 5 years. Nationwide, 3.85% of mortgage holders were at least two months behind on their payments in the October-December quarter, compared to 5.08% a year before.


The California Association of Realtors®reported that the percentage of home buyers who could afford to purchase a median-priced, existing single-family home in California in the fourth quarter of 2013 was unchanged from the third quarter of 2013 at 32%, but was down from 48% in fourth-quarter 2012, according to C.A.R.’s Traditional Housing Affordability Index (HAI).  Home buyers needed to earn a minimum annual income of $89,240 to qualify for the purchase of a $431,510 statewide median-priced, existing single-family home in the fourth quarter of 2013.The median home price was $352,450 in fourth-quarter 2012, and an annual income of $66,860 was needed to purchase a home at that price. California housing affordability hit a record high of 56% in first quarter of 2012 but has steadily declined since then. In Los Angeles the affordability index in the fourth quarter of 2013 was 34%, down from the third quarter’s 35% and much reduced from the fourth quarter of 2012’s 50%.

DataQuick reported that home prices fell 3.8% in January compared with December and sales were down -9.9% year over year, though the median price was up 18.4% compared with January of last year. January’s median home price, $380,000, is the lowest since May 2013.  For the six-county Southland area 14,471 new and resale homes and condos were sold last month, a three-year low for January. For Los Angeles alone, 5,308 homes were sold, a -7.4% decrease from January 2013. The median price however rose 20.6% from $340,000 to $410,000.

 There was an article this week in the L.A. Times about home prices stalling. A broker was quoted in the Inland Empire. That is not what is happening here! I doubt it’s happening there either. We definitely need more homes on the market as we are seeing record sales prices! We all should have bought more Real Estate in the last few years. Let’s not be saying the same thing at years end! 

Economic Update For January 2014 With Syd Leibovitch

economicupdate01312014January saw some corrections in the stock market with the S&P 500 and the Dow posting their biggest monthly percentage decline since May 2012. This was the first January since 2010 with a decline.

The Dow closed out the month at 15,698.85  down -5.3% from last month’s close of 16,576.60 and down -1.14% from last week’s close of 15,879.11.

The Nasdaq fared a bit better, ended the month at 4,103.88 down -1.7% from last month’s close of 4,166.66 and down -0.59% from last week’s 4,128.17 close.

The S&P 500 ended the month at 1,782.59, a drop of -3.56% from last month’s 1,848.36 close and down -0.43% from last week’s 1,790.29 close.

Interest rates dropped during the month. The Freddie Mac Weekly Primary Mortgage Market Survey showed that the 30-year-fixed rate dropped to 4.32% from 4.39% last week and 4.53% at the start of the month.  The 15-year-fixed fell to 3.40% from last week’s 3.44% and 3.55% at the start of the month. A year ago the 30-year fixed was at 3.53% and the 15-year was at 2.81%.

Over the course of January 10-year Treasury note yield rate fell after starting the month at 3.0%  It closed out the month at 2.67%  after ending last week at 2.75%. It was 2.02% a year ago.

Los Angeles County’s unemployment rate fell to 9.2% in December down from 9.5% in November and 10.3% in December 2012. This is its lowest point in more than five years. The state rate is 8.3% and the national rate was 6.7% in December.

Consumer confidence has risen again. The Conference Board reported that the consumer confidence index increased to 80.7 this month from a downwardly revised 77.5 in December beating economists’ estimates of a 79 reading. The index is now higher than it was in September before the confidence-eroding government shutdown and is at its highest level since August. However the consumer sentiment gauge from the University of Michigan and Thomson Reuters registered a final reading of 81.2 in January, down from December’s 82.5. In December, consumer spending rose a seasonally adjusted 0.4% which was above analysts’ expectations of a 0.2% gain. Economists are predicting consumer spending will rise at least 2% over the course of the year.

The Commerce Department reported that sales of new U.S. homes decreased -7% to a 414,000 annualized pace in December, lower than was predicted by economists who predicted a 455,000 pace last month. For all of 2013, demand was up 16.4% to 428,000. The median sales price of a new home rose 4.6%  from December 2012 to $270,200. New-housing demand has rebounded from a record-low 306,000 homes sold in 2011, the record peak was 1.28 million in 2005. I would attribute this to very low inventory which is also causing rapid price increases.

The latest S&P/Case-Shiller Home Price Index shows that the 20-city composite rose 13.7% year over year through November 2013 while declining -0.1% from the previous month. Nine out of 20 cities recorded positive  monthly returns  including Los Angeles which saw a 0.1% increase. It is predicted that while housing prices will continue to rise, the pace of the rise will be slower in 2014.

The National Association of Realtors reported that its Pending Home Sales Index dropped -8.7%last month to 92.4, the lowest level since October 2011. Contracts were down 8.8% from the December 2012 levels. It is believed that unusually harsh weather across the country caused the low numbers of potential buyers. The index in the West dropped 9.8%  in December to 85.7, and is 16.0%  below December 2012 and this is attributed to  the lack of inventory in the market.

As I wrote last week we are beginning to see another increase in prices and buyer demand. It appears that 2014 will be much like 2013. The question is: How high can prices go? That’s not a new question. We recently sold a home in Beverly Hills for $15 million that the buyer bought for $475,000 in 1976! A valley home that just sold for $630,000 was purchased for $98,000 in 1980. All my life, with the exception of a few down years every 20 years or so, I have been hearing the question: How high can prices go? The answer is: Who knows! Definitely they are going up. The question is how long. I’d expect these gains to begin to level in a year or so. Anyone who doesn’t buy now will wish in 6 months that they did!

Economic Update For The Week Ending January 24, 2014 with Syd Leibovitch

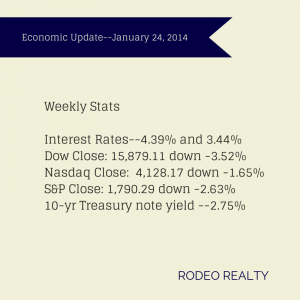
economic update 01242014Stocks took a substantial slide this week as the Dow closed the week under the 16,000 mark with both the Dow and S&P 500 taking their worst weekly losses in over a year. There was a substantial selloff on Thursday as investors digested weak Chinese economic data and dealt with currency drops in emerging markets. Some economists are saying that this may be the beginning of a correction in the stock market after last year’s meteoric rise. The Dow closed out the week at 15,879.11 down -3.52% from last week’s close of 16,458.56. The Nasdaq closed at 4,128.17 down -1.65% from last week’s 4,197.58 close. The S&P 500 finished the week at 1,790.29 down –2.63% from last week’s 1,838.70 close.

Interest rates dropped this week awaiting the next meeting of the Fed later this month. The Freddie Mac Weekly Primary Mortgage Market Survey showed that the 30-year-fixed rate dropped to 4.39% from 4.41% last week.  The 15-year-fixed fell to 3.44% from last week’s 3.45%. A year ago the 30-year fixed was at 3.42% and the 15-year was at 2.71%. Loans over $417,000 are about 1/2% higher in rate.

The 10-year Treasury note yield rate continues to fall this week ending at 2.75%, after last week’s 2.84% close. It was 1.88% a year ago, but reached 3% in December.

The National Association of Realtors® reported that existing home sales were up 1.0% in December increasing to a seasonally adjusted annual rate of 4.87 million in December from a downwardly revised 4.82 million in November. This is – 0.6%  below the 4.90 million-unit level in December 2012. For all of 2013, there were 5.09 million sales, which is 9.1% higher than 2012. It was the strongest performance since 2006. The national median existing-home price for all of 2013 was $197,10011.5%  above the 2012 median of $176,800, and was the strongest gain since 2005 when it rose 12.4%. The median existing-home price for all housing types in December was $198,000, up 9.9%  from December 2012. Distressed homes represented 14% of December sales; they were 24% in December 2012. Total housing inventory at the end of December fell 9.3%  to 1.86 million existing homes available for sale, which represents a 4.6-month supply at the current sales pace, down from 5.1 months in November. I use these numbers to point out that the dramatic price increase we have seen has been similar though out many areas nationally.

 Realtor.com® released its final National Housing Trend Report for 2013 which showed that the median list price for December 2013 was 8.1% above December 2012, the median age of inventory was down by -5.1% and the number of units for sale was essentially unchanged. The total inventory of homes for sale in the United States declined from 1,846,155 units in November to 1,731,017 units in December, while month-over-month inventory rose from 101 to 112 days, and the median list price declined from $197,700 to $194,500. The median price for the Los Angeles-Long Beach MSA rose 28.5% for the year, up to $455,000 while the amount of listings fell by -9.75% to 19,633 and the median age of inventory fell for the year by 12.33% to 64.

DataQuick announced that California foreclosure activity hit an eight-year low in the fourth quarter of 2013 with a total of 18,120 default notices filed on houses and condominiums from October through December, down -10.8% from 20,314 in the previous quarter and down a whopping -52.6%from 38,212 from the same period of 2012. This marks the lowest number of default notices since 15,337 were filed in the fourth quarter of 2005.

The Pending Homes Sales Index for December from the California Association of Realtors® showed that pending sales dropped -25.2%  in December to reach 68.8 down from a revised index of 92 in November, based on signed contracts. Pending sales were down 16.8% from the revised 82.8 index recorded in December 2012. The share of equity sales in December dipped to 84.3%, down from 86.4% in November. Equity sales made up 63.4%  of sales in December 2012. The share of distressed sales to total sales in Los Angeles County was 18% in December 2013. It was 14% in November and 35% in December 2012.

We are seeing activity begin to increase dramatically. Over the last week our open escrow count has began to increase rapidly. We are also seeing what appears to me as another surge in prices. This is not unusual. It is common for prices to increase steadily from February to June or so and then flatten. I’d expect the same in 2014!

Economic Update For The Week Ending January 10 by Syd Leibovitch

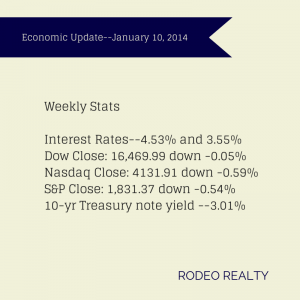
stats01102014The labor market closed out 2013 by adding just 74,000 jobs in December, the lowest number of new jobs since January 2011. However, the unemployment rate fell from 7% to 6.7%, the lowest since October 2008, the Labor Department said, mostly due to a drop of 347,000 in the labor force — the number of Americans working or looking for work. Most economists feel that the low number was an outlier and not an indicator of the future of the job market. By contrast, ADP’s survey showed that businesses added 238,000 jobs in December, the most in 13 months and economists were predicting a jobs report closer to the 200,000 mark.  The Labor Department’s report showed businesses added 87,000 jobs while federal, state and local governments cut 13,000. Job gains for November were revised upward to 241,000 from 203,000. All told the economy gained an average of 182,000 jobs per month in 2013 essentially the same as in 2012 (2.18 million jobs in 2012, 2.19 million in 2012). Congress continues to debate an unemployment insurance bill that would extend emergency unemployment insurance for the 1.4 million Americans.

This disappointing job report caused rates to drop sharply throughout the day. By the end of the day rates dropped by about 1/8% in rate or 1% in loan fee! It was a shockingly low number that took everyone by surprise. The question now is: what does this do to the Federal Reserves announced drawing down of mortgage and bond buying stimulus program? The announced draw down has driven rates up.

Stocks were mixed this week as investors processed the jobs numbers as well as disappointing returns from Sears, and news that the Target credit card data breach was larger than expected. TheDow closed out the week at 16,437.05 down –0.2% from last week’s close of 16,469.99. The Nasdaq closed at 4,174.66 up 1.03% from last week’s 4,131.91 close. The S&P 500 finished the week at 1,842.37 up 0.6% from last week’s 1,831.37 close.

The 10-year Treasury note yield rate spent the week diving back under 3% ending at  2.88%, after last week’s 3.01% close, the highest number seen since July 2011.  It was 1.91% a year ago.

Interest rates remained relatively flat this week as the Market waits the see how the Federal Reserve will move forward with the bond-buying program. Policy makers at the Fed including the newly-appointed Janet Yellen will meet later this month to set the pace for the bond-buying taper. The Freddie Mac Weekly Primary Mortgage Market Survey showed that the 30-year-fixed rate dropped slightly to 4.51% from 4.53% last week.  The 15-year-fixed rose to 3.56% from last week’s 3.55%. A year ago the 30-year fixed was at 3.40% and the 15-year was at 2.66%. Expect these rates to be lower when announced next week due to today’s drop. Jumbo and high balance conforming rates are about 3/8% higher than the Freddie Mac rate.

The new mortgage rules issued by the Consumer Financial Protection Bureau take effect today. The rules are designed to discourage predatory lending. Most lenders have already adopted these practices so there shouldn’t be too much difference however there will be increasing attention paid to a borrower’s debt-to-income ratio; it may become harder for people with higher debt loads to get approved for a new home if they cannot stay below the 43% debt-to-income ratio.

The latest Fannie Mae Monthly National Housing Survey for December shows that 49% of U.S. adults say home prices will rise throughout 2014, up from 43% in December 2012. The survey showed that 33% of homeowners say it’s a good time to sell, up from 21% a year ago. People also believe that home values will rise more this year: 3.2% in December compared to 2.6% in December 2012.
CoreLogic released data showing that U.S. home prices increased 0.1% in November, up 11.8%from a year ago but showing a slowing pace of increase. These figures aren’t adjusted for seasonal patterns.

Economic Update For The Week Ending October 4

capitol buildingWe are four days into the government shutdown and Congress now has less than two weeks to raise the debt ceiling before the U.S. is unable to borrow money to pay its bills, a move that could lead to a historic default. Most industry analysts still believe this will not occur. Frankly, I am surprised that the stock markets and the economy has held up so will this week. You would think that with such dysfunction in our government and 750,000 government workers furloughed the markets would react more negatively. I fear that if they can not agree to increase the debt limit, which will lead to the first default in U.S. history, the negative impact will be much more severe! I really do not think a default will happen.

Due to the turmoil of the government shutdown stocks continued to act uncertainly. The Dow rose on Friday but had its second down week in a row closing at 15,072.58 down -1.22% from last week’s 15,358.24 close. The Nasdaq eked out another modest gain, closing at 3,807.75, a gain of .69% off last week’s 3,781.59 close, for its fifth straight week of positive numbers. The S&P 500 was down very slightly, closing the week at 1,690.50 just a hair below last week’s 1,691.75 close. The yield rate for the 10-year Treasury note was at 2.66% nearly on par with last week’s 2.64% finish.

ADP reported that businesses added 166,000 jobs in September below the 180,000 number expected by economists. The payroll processor also adjusted its previously reported August figure downward from 176,000 to 159,000. The Labor department did not release its jobs numbers due to the government shutdown. Those numbers are really the numbers that experts look at.

The government shutdown appears to be having an impact on interest rates. Rates were down again this week according to the  Freddie Mac Weekly Primary Mortgage Market Survey. The 30-year fixed rate dropped down to 4.22% down from 4.32% last week. The 15-year rate also fell to 3.29% from 3.37%. These are the lowest averages seen since late June. A year ago this week according to the survey, the 30-year rate was at 3.36% while the 15-year rate was at 2.69%. Jumbo and high balance conforming are running around 4.625% for 30 year fixed and 3.75% for 15 year terms.

For some reason it seems like open escrows have picked up in the last couple weeks. I would not have expected this.