Fed leaves rates unchanged – Trump nominated a new Fed Chairman – The Federal Reserve ended its January Open Market Committee Meeting (FOMC) on Wednesday and elected to leave interest rates unchanged. While many investors were not surprised due to comments from Fed Chairman Powell and other Fed members, it was a reverse in direction from a ¼% rate drop at its previous three meetings. Powell stated after the meeting that inflation remained elevated but that they felt that it was tariff-related, not demand-driven, an indication that he was not feeling that the economy was heating up. He also said that they felt the labor market was stabilizing. It had suffered its worst year in job gains and the highest unemployment rate since COVID. On Friday, President Trump nominated Kevin Warsh to succeed Jerome Powell as the next Fed Chairman. Powell’s term ends in May.
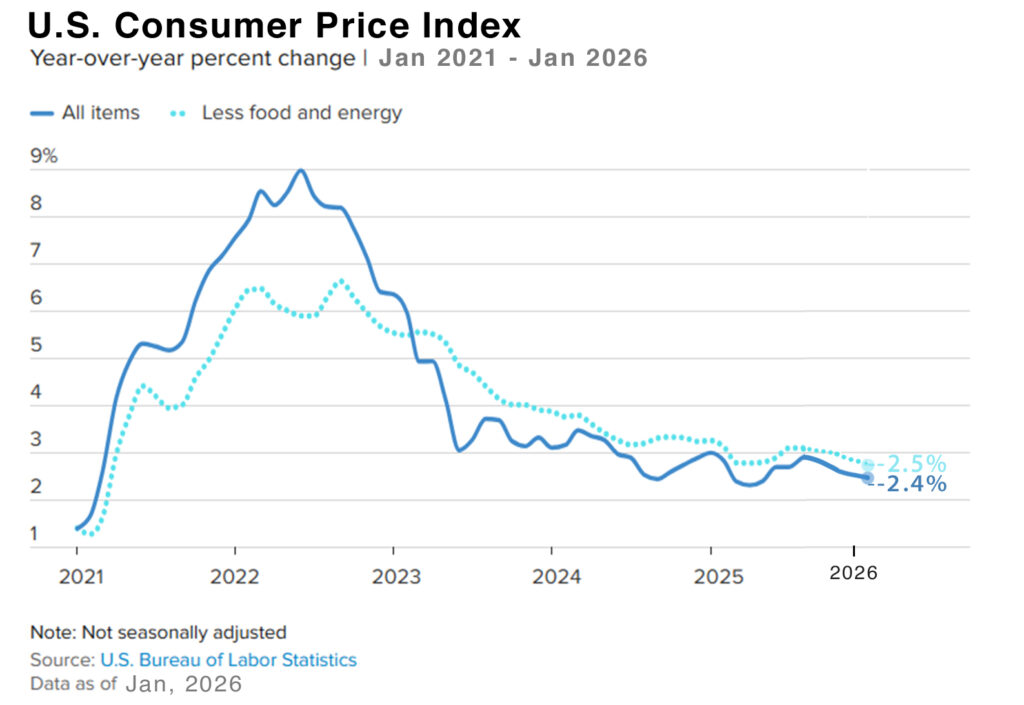
Inflation – Consumer prices show inflation levels remained unchanged in December – The December Consumer Price Index (CPI) was released this week. It showed that consumer prices rose 2.7% from one year ago in December. This was slightly higher than analysts’ expectations of a 2.6% annual increase. Core CPI, which excludes volatile goods like food and energy, rose 2.6% on an annualized basis. This was below the 2.7% increase experts had forecasted.
Job growth stalled and the unemployment rate rose in 2025 – December Jobs report shows hiring was sluggish while the unemployment rate dipped. Recent labor market data point to a continued moderation in U.S. hiring activity. The Bureau of Labor Statistics reported that 50,000 new jobs were added in December. That was below the analyst’s expectations of 70,000. Revisions to the prior two months reduced reported job gains by a combined 76,000. As a result, average monthly job growth for 2025 stands at 49,000, down from 168,000 in 2024, and the three-month average has turned modestly negative. For the year employers added just 584,000 jobs last year, down from 2.2 million new jobs in 2024, marking its worst non-recession year of job growth since 2003. At the same time, the unemployment rate dropped to 4.4% in December, down from a revised 4.5% in November. That is better than economists’ expectations of 4.5% and below the long-term historical average of approximately 5.5%. Despite the slowdown in hiring, average hourly earnings rose 3.8% compared to one year ago.
The graph below shows the CPI rate since 2021

Stock markets – The Dow Jones Industrial Average ended the month at 48,892.47, up 1.7% from 48,063.29 on December 31, 2025. The S&P 500 closed the month at 6,939.03, up 1.4% from 6,845.50 on December 31, 2025. The NASDAQ closed at 23,461.82, up 0.9% from 23,241.99 at the end of December.
U.S. Treasury Bond Yields – The 10-year U.S. Treasury bond yield closed the month at 4.26%, up from 4.18% on December 31, 2025. The 30-year US treasury bond yield ended the month at 4.87%, up from 4.84% on Dec. 31, 2025. We watch bond yields because mortgage rates often follow Treasury bond yields.
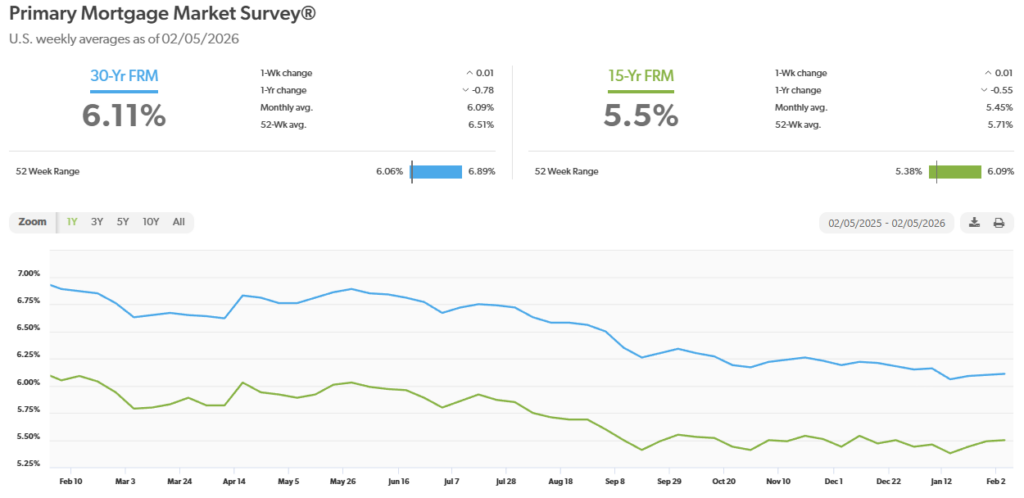
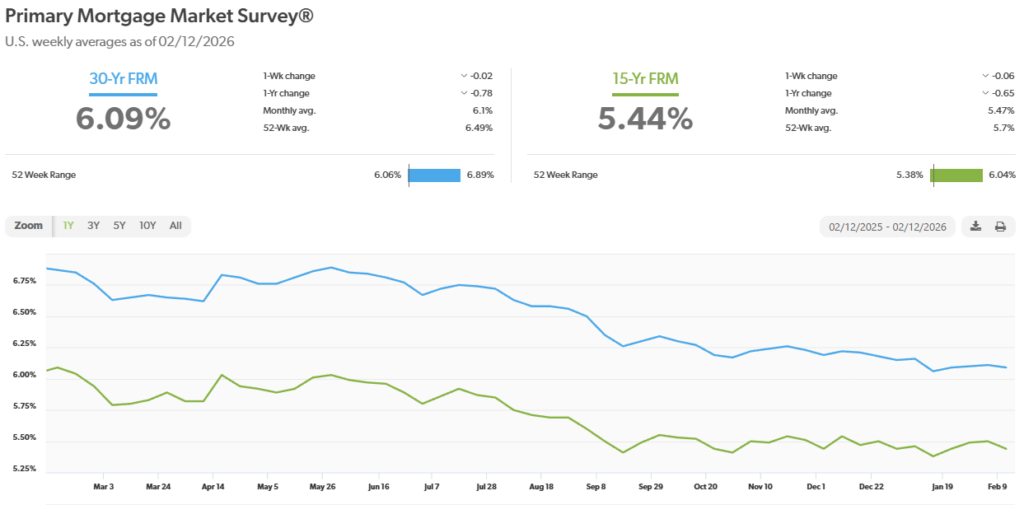
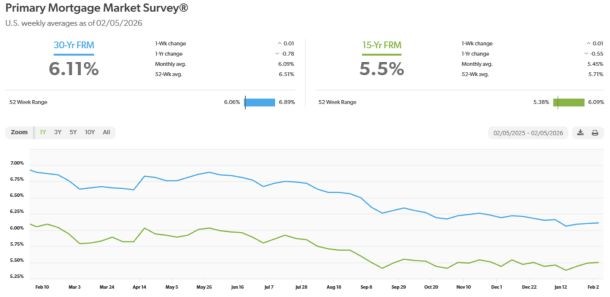
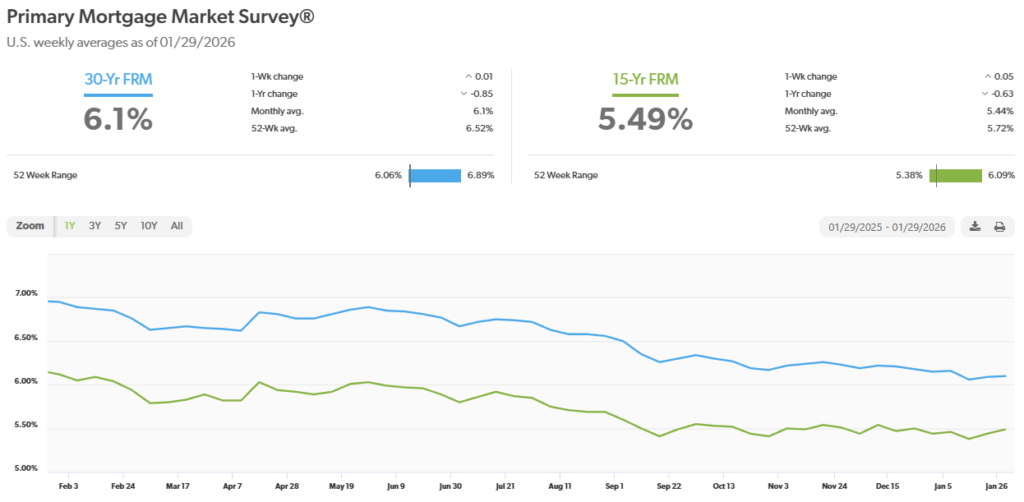
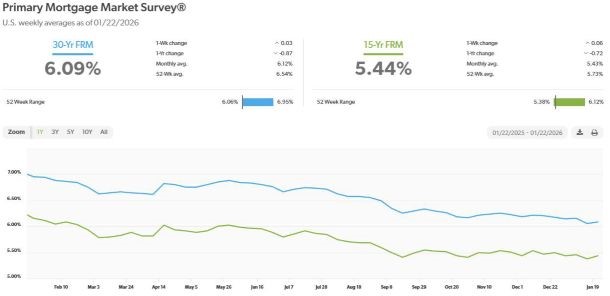
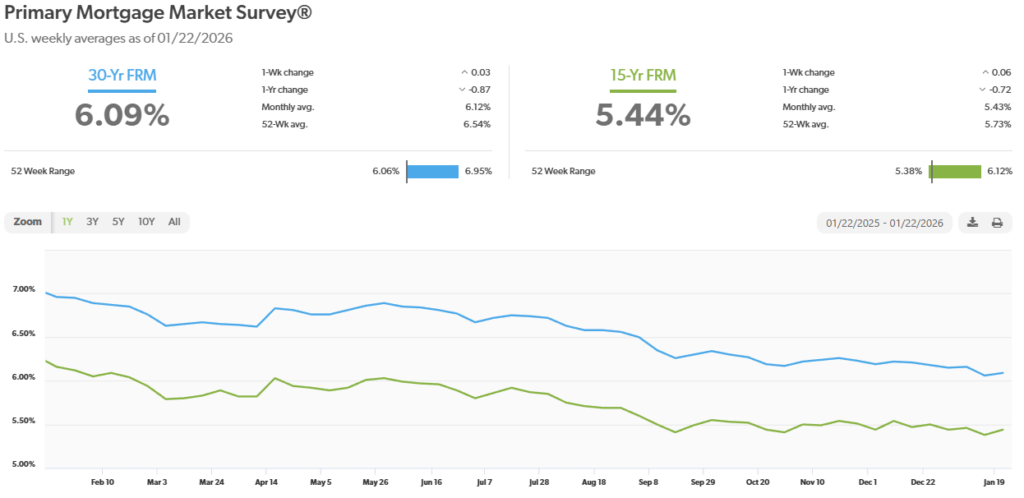
Mortgage rates – The Freddie Mac Primary Mortgage Survey reported that mortgage rates for the most popular loan products as of December 29, 2025, were as follows: The 30-year fixed mortgage rate was 6.10%, down from 6.15% on December 31, 2025. The 15-year fixed was 5.49%, up from 5.44% on December 31, 2025.
The graph below shows the trajectory of mortgage rates over the past year.

Home sales figures are released on the third week of the month for the previous month from the National Association of Realtors and the California Association of Realtors. Here is a summary of the December existing home sales reports.
U.S. existing-home sales – December 2025 – The National Association of Realtors reported that existing-home sales totaled 4.35 million units on a seasonally adjusted annualized rate in November, up 5.1% from the number of homes sold in November and up 1.4% from the number of homes sold last December. The median price paid for a home sold in the U.S. in November was $404,400, down slightly from $409,200 in November, but up 0.4% from $403,700 one year ago.
California existing-home sales – The California Association of Realtors reported that existing-home sales totaled 288,200 on an annualized basis in December, up 2% from a revised 282,490 last December. The statewide median price paid for a home was $850,680 in December, down 0.4% from $855,680 in November. The statewide median price peaked at $910,160 in April before falling steadily each month to end the year down 7% from its peak. Year-over-year, the median price dropped 1.3% from $861,020 on December 31, 2024.
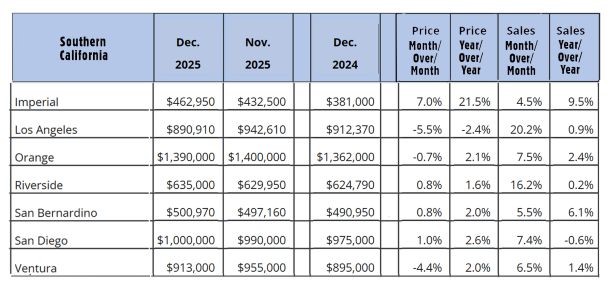
The graph below shows CAR sales data by county for Southern California.