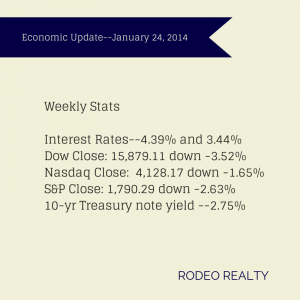
 Stocks took a substantial slide this week as the Dow closed the week under the 16,000 mark with both the Dow and S&P 500 taking their worst weekly losses in over a year. There was a substantial selloff on Thursday as investors digested weak Chinese economic data and dealt with currency drops in emerging markets. Some economists are saying that this may be the beginning of a correction in the stock market after last year’s meteoric rise. The Dow closed out the week at 15,879.11 down -3.52% from last week’s close of 16,458.56. The Nasdaq closed at 4,128.17 down -1.65% from last week’s 4,197.58 close. The S&P 500 finished the week at 1,790.29 down –2.63% from last week’s 1,838.70 close.
Interest rates dropped this week awaiting the next meeting of the Fed later this month. The Freddie Mac Weekly Primary Mortgage Market Survey showed that the 30-year-fixed rate dropped to 4.39% from 4.41% last week. The 15-year-fixed fell to 3.44% from last week’s 3.45%. A year ago the 30-year fixed was at 3.42% and the 15-year was at 2.71%. Loans over $417,000 are about 1/2% higher in rate.
The 10-year Treasury note yield rate continues to fall this week ending at 2.75%, after last week’s 2.84% close. It was 1.88% a year ago, but reached 3% in December.
The National Association of Realtors® reported that existing home sales were up 1.0% in December increasing to a seasonally adjusted annual rate of 4.87 million in December from a downwardly revised 4.82 million in November. This is – 0.6% below the 4.90 million-unit level in December 2012. For all of 2013, there were 5.09 million sales, which is 9.1% higher than 2012. It was the strongest performance since 2006. The national median existing-home price for all of 2013 was $197,100, 11.5% above the 2012 median of $176,800, and was the strongest gain since 2005 when it rose 12.4%. The median existing-home price for all housing types in December was $198,000, up 9.9% from December 2012. Distressed homes represented 14% of December sales; they were 24% in December 2012. Total housing inventory at the end of December fell 9.3% to 1.86 million existing homes available for sale, which represents a 4.6-month supply at the current sales pace, down from 5.1 months in November. I use these numbers to point out that the dramatic price increase we have seen has been similar though out many areas nationally.
Realtor.com® released its final National Housing Trend Report for 2013 which showed that the median list price for December 2013 was 8.1% above December 2012, the median age of inventory was down by -5.1% and the number of units for sale was essentially unchanged. The total inventory of homes for sale in the United States declined from 1,846,155 units in November to 1,731,017 units in December, while month-over-month inventory rose from 101 to 112 days, and the median list price declined from $197,700 to $194,500. The median price for the Los Angeles-Long Beach MSA rose 28.5% for the year, up to $455,000 while the amount of listings fell by -9.75% to 19,633 and the median age of inventory fell for the year by 12.33% to 64.
DataQuick announced that California foreclosure activity hit an eight-year low in the fourth quarter of 2013 with a total of 18,120 default notices filed on houses and condominiums from October through December, down -10.8% from 20,314 in the previous quarter and down a whopping -52.6%from 38,212 from the same period of 2012. This marks the lowest number of default notices since 15,337 were filed in the fourth quarter of 2005.
The Pending Homes Sales Index for December from the California Association of Realtors® showed that pending sales dropped -25.2% in December to reach 68.8 down from a revised index of 92 in November, based on signed contracts. Pending sales were down 16.8% from the revised 82.8 index recorded in December 2012. The share of equity sales in December dipped to 84.3%, down from 86.4% in November. Equity sales made up 63.4% of sales in December 2012. The share of distressed sales to total sales in Los Angeles County was 18% in December 2013. It was 14% in November and 35% in December 2012.
We are seeing activity begin to increase dramatically. Over the last week our open escrow count has began to increase rapidly. We are also seeing what appears to me as another surge in prices. This is not unusual. It is common for prices to increase steadily from February to June or so and then flatten. I’d expect the same in 2014!