June wrap-up – As we close out June, the economy continues to send mixed signals. Inflation remains the primary concern, with the latest CPI reading increasing to 4.2%, driven largely by higher energy prices during the Middle East conflict. While inflation has moved higher, much of the increase appears concentrated in energy rather than broad-based throughout the economy, leading many economists to believe inflation pressures could ease in the months ahead as oil prices continue to decline.
The biggest economic story of the month may be the potential end of the conflict in the Middle East and the resulting memorandum of understanding between the parties involved. During the height of the crisis, oil briefly surged to approximately $120 per barrel amid concerns over disruptions in the Strait of Hormuz, through which roughly 20% of the world’s oil supply passes. Today, oil prices have retreated to approximately $70 per barrel, removing a major inflationary pressure from the economy.
Despite the decline in oil prices and easing geopolitical tensions, bond yields and mortgage rates have been slower to respond than many had expected. The bond market remains cautious, waiting for additional evidence that inflation is moving sustainably lower before pricing in meaningful interest rate reductions. For the housing market, this means mortgage rates remain elevated even as some of the factors that pushed them higher begin to fade. The coming months will likely be defined by one question: Does lower energy inflation finally translate into lower bond yields and lower mortgage rates?
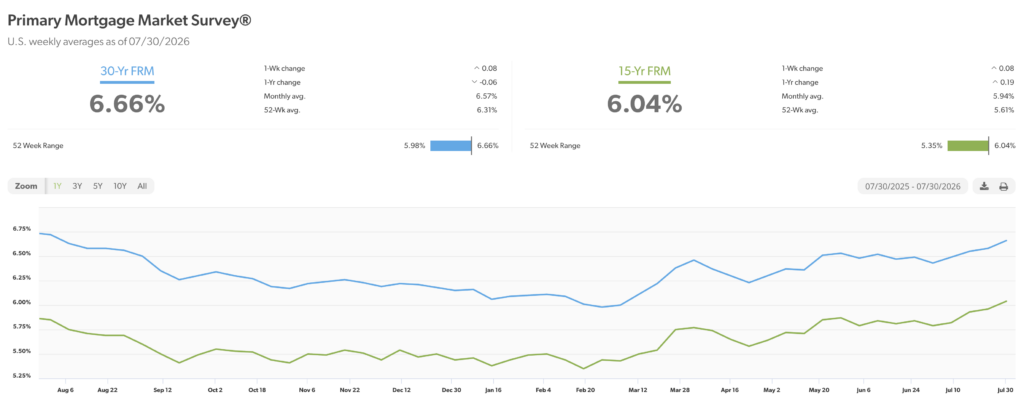
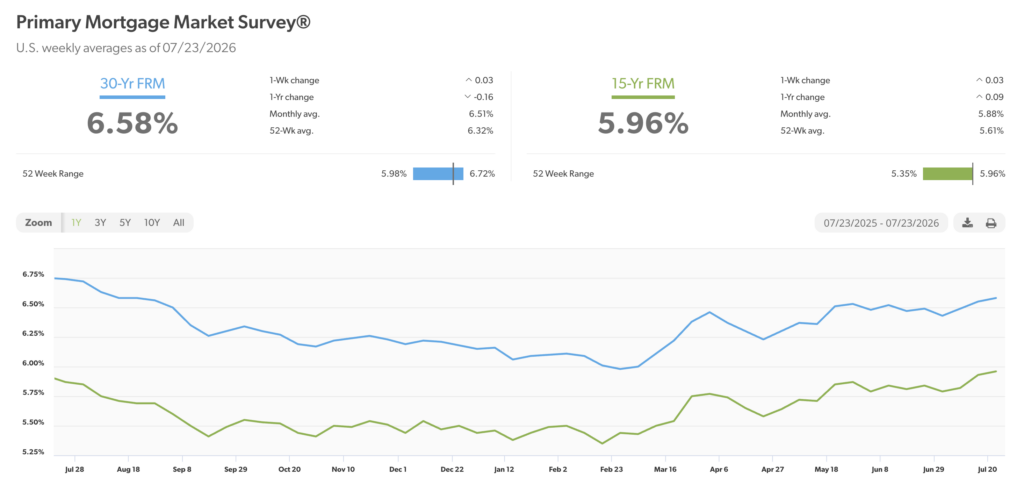
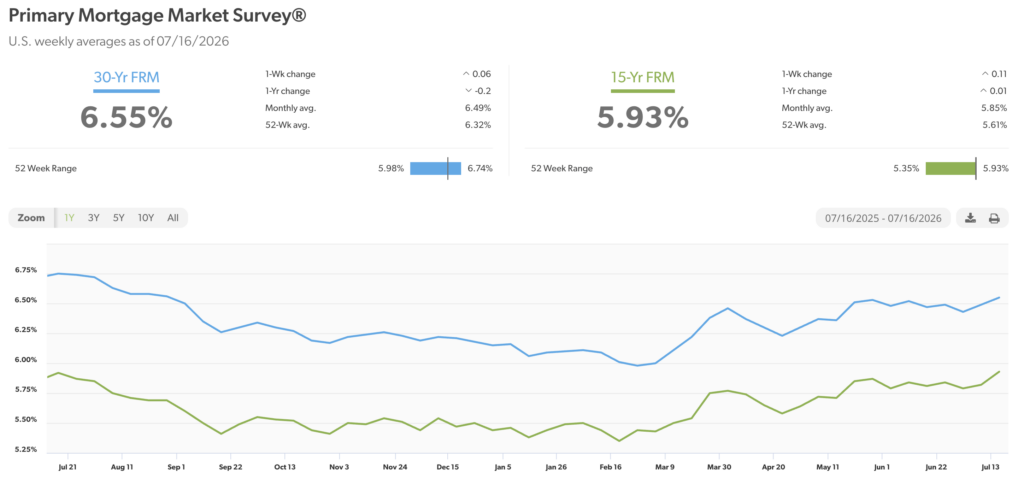
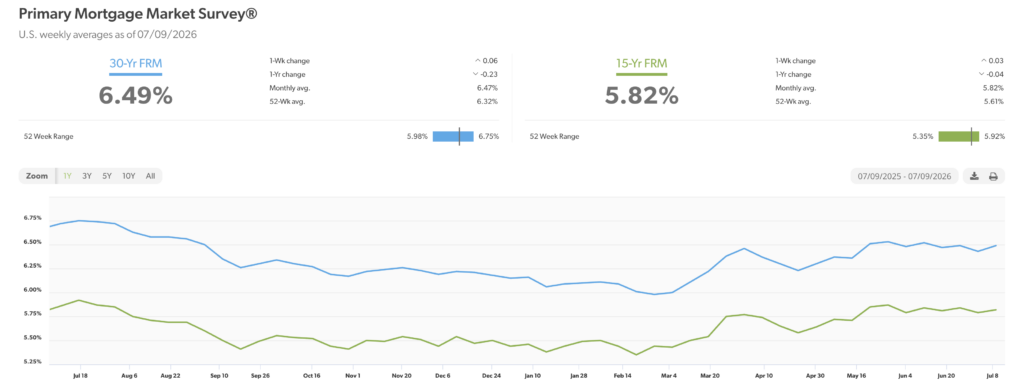
Mortgage rates – Every Thursday, Freddie Mac publishes interest rates based on a survey of mortgage lenders throughout the week. The Freddie Mac Primary Mortgage Survey reported that mortgage rates for the most popular loan products as of May 28, 2026, were as follows: The 30-year fixed mortgage rate was 6.49%, down slightly from 6.53% last month. The 15-year fixed was 5.84%, down slightly from 5.87% last month.
The graph below shows the trajectory of mortgage rates over the past year.

Consumer prices rose 4.2% annually in May – The Consumer Price Index released this week. It showed that consumer prices for all goods increased 4.2% year-over-year in May. That marked the highest annual inflation rate in three years. In February 2026, before the war began, inflation had fallen to 2.4%, its lowest annual rate in three years. After the war started, the CPI rate jumped form 2.4% in January and February to 3.3% in March, 3.8% in April and now 4.2% in May. Most of the increase was due to a 3.9% month-over-month increase in energy prices.

Stock markets – Dow Jones Industrial Average closed the month at 52,319.20, up 2.5% from 51,032.36 on last month. The Dow is up 8.9% year-to-date from 48,063.29 on December 31, 2025. The S&P 500 closed the week at 7,499.36, down 1.2% from 7,589.06 last month. The S&P is up 9.6% year-to-date from 6,845.50 on December 31, 2025. The Nasdaq closed the week at 26,213.72, down 2.2% from 26,792.62 at the end of May. The Nasdaq is up 12.8% year-to-date from 23,241.99 on December 31, 2025.
U.S. Treasury Bond Yields – The 10-year U.S. Treasury bond yield closed the month at 4.44%, almost unchanged from 4.45% on May 30, 2026. The 30-year US treasury bond yield ended the month at 4.91%, down slightly from 4.99% on May 30, 2026. We watch bond yields because mortgage rates often follow treasury bond yields.
Home sales figures are released on the third week of the month for the previous month by the National Association of Realtors and the California Association of Realtors. Here is a summary of the May existing home sales reports.
U.S. existing-home sales – April 2026 – The National Association of Realtorsreported that existing home sales totaled 4.17 million units on a seasonally adjusted annualized rate in May, up 3.2% from the number of homes sold last May. The median price paid for a home in the U.S. in May was $429,300, up 1.3% year-over-year from $423,700 one year ago.
California existing-home sales – The California Association of Realtors reported that existing-home sales totaled 268,810 on an adjusted annualized basis in May, down 3.1% from 277,360 in April. The statewide median price paid for a home was $930,260 in May, up 3.1% from $909,410 last May. The increase in the median price was attributed to more homes selling in the higher price range than the lower range, as higher price range buyers have been less impacted by gas prices, inflation, etc. They also have more money in the stock markets, which are at or near record highs.
Below is the housing data for Southern California by County.