| Stock markets – The Dow Jones Industrial Average closed the week at 39,150.33, up down 1.5% from 38,586.16 last week. It is up 3.9% year-to-date. The S&P 500 closed the week at 5,464.62, up 0.6% from 5,431.16 last week. The S&P is up 14.6% year-to-date. The Nasdaq closed the week at 17,689.36 unchanged from 17,688.88 last week. It is up 17.8% year-to-date.
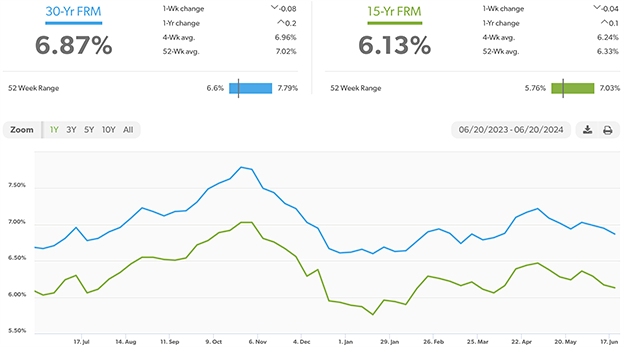
U.S. Treasury bond yields – The 10-year treasury bond closed the week yielding 4.25%, up from 4.20% last week. The 30-year treasury bond yield ended the week at 4.39% up slightly from 4.34% last week. We watch bond yields because mortgage rates follow bond yields. Mortgage rates – Every Thursday Freddie Mac publishes interest rates based on a survey of mortgage lenders throughout the week. The Freddie Mac Primary Mortgage Survey reported that mortgage rates for the most popular loan products as of June 20, 2024, were as follows: The 30-year fixed mortgage rate was 6.87%, down from 6.95% last week. The 15-year fixed was 6.13%, down from 6.17% last week. The graph below shows the trajectory of mortgage rates over the past year.
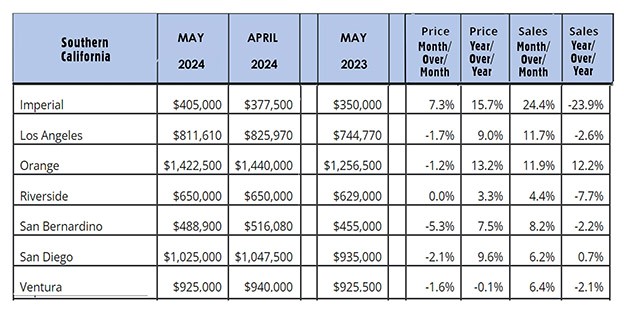
Freddie Mac was chartered by Congress in 1970 to keep money flowing to mortgage lenders in support of homeownership and rental housing. Their mandate is to provide liquidity, stability, and affordability to the U.S. Home sales data is released on the third week of the month for the previous month by the National Association of Realtors and the California Association of Realtors. These are May’s home sales figures. U.S. existing-home sales – The National Association of Realtors reported that existing-home sales totaled 4.11 million units on a seasonally adjusted annualized rate in May, down 2.8% from an annualized rate of 4.23 million last May. The median price for a home in the U.S. in May was $419,300, up 5.8% from $396,500 one year ago. There was a 3.8-month supply of homes for sale in May, up from a 3.1-month supply one year ago. First-time buyers accounted for 32% of all sales. Investors and second-home purchases accounted for 16% of all sales. All-cash purchases accounted for 28% of all sales. Foreclosures and short sales accounted for 2% of all sales. Year-over-year California home prices jumped 8.7% in May – The California Association of Realtors reported that existing-home sales totaled 277,410 on an annualized rate in May, down 6% from a revised 298,860 homes sold on an annualized basis last May. There was a 2.6-month supply of homes for sale, up from a 2.1-month supply one year ago. The statewide median price paid for a home in April was $908,040, up 8.7% from a revised median price of $835,280 one year ago. The graph below shows sales data by county in Southern California.
Have a great weekend! |
News & Media