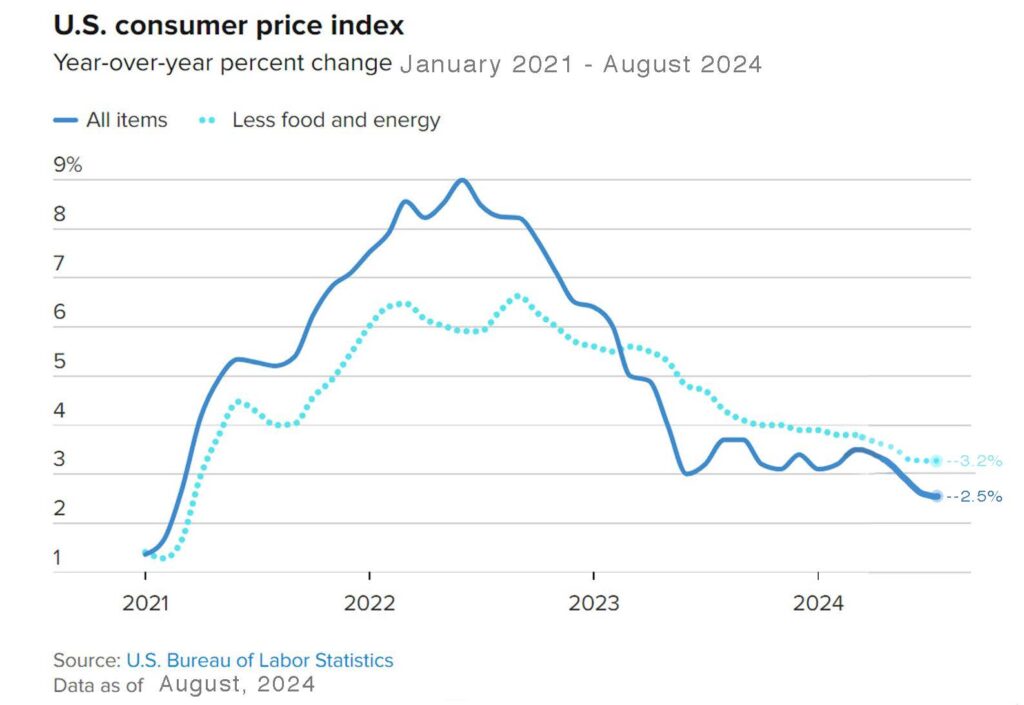
Federal Reserve declares that inflation is under control and makes its first rate cut in four years – The Fed dropped its key interest rates by a ½% in September. With inflation spiking in 2022, the Fed enacted one of its most aggressive rate hike campaigns in history. They increased rates steadily until they hit a 25-year high. Now that inflation has worked its way down the Fed has begun a campaign of dropping rates to a more “neutral rate” from their previous “restrictive rate.” Experts expect two more rate drops before the end of the year, likely .25% each. The inflation reports for August were as follows: The Consumer Price Index (CPI) measured 2.5% in August. It peaked at 9.1% in June 2022 and has worked its way down slowly over the past twenty-eight months. The Producer Price Index (PPI) showed wholesale rose just 1.7% from last August. The Personal Consumption Expenditure Index (PCE) for August, a key gauge of inflation that the Fed focuses on to measure the cost of goods and services in the U.S. economy showed that the 12-month inflation rate was 2.2%, down from 2.5% in July and its lowest reading since February 2021. On Friday we will get the September Jobs report. That report will have an impact on bond yields and mortgage rates, which did not drop after the Fed announced its rate drop. That drop was expected and was already “built into” long-term bond yields and mortgage rates. The government released its third revision of the second quarter Gross Domestic Product (GDP), the broadest measure of the strength of the economy. It showed that the economy grew at a 3% annualized pace in the second quarter, a faster rate than Wall Street had expected. The Fed is pointing to a “soft landing” where they expect the economy to remain healthy while inflation continues to moderate. Many experts felt that the dramatic rise in rates would put the country into a recession but so far that has not happened. With the Fed now lowering rates the hope is that a recession will be avoided.
The graph below shows the movement of the Consumer Price Index from 2021 to the present.
Stock Markets – The Dow and S&P 500 closed September at record highs, and the NASDAQ closed just 2.5% off its record set in July. The Dow Jones Industrial Average closed the month at 42,330.15, up 1.8% from 41,563.08, on August 31, 2024. It is up 12.3% year-to-date. The S&P 500 closed the month at 5,762.58, up 2% from 5,648.40 last month. It is up 20.8% year-to-date. The NASDAQ closed the month at 18,189.17, up 2.7% from 17,713.63 last month. It is up 21.2% year-to-date.
U.S. Treasury bond yields – The 10-year treasury bond closed the month yielding 3.81%, down from 3.91% last month. The 30-year treasury bond yield ended the month at 4.14%, down from 4.20% last month. We watch bond yields because mortgage rates often follow treasury bond yields.
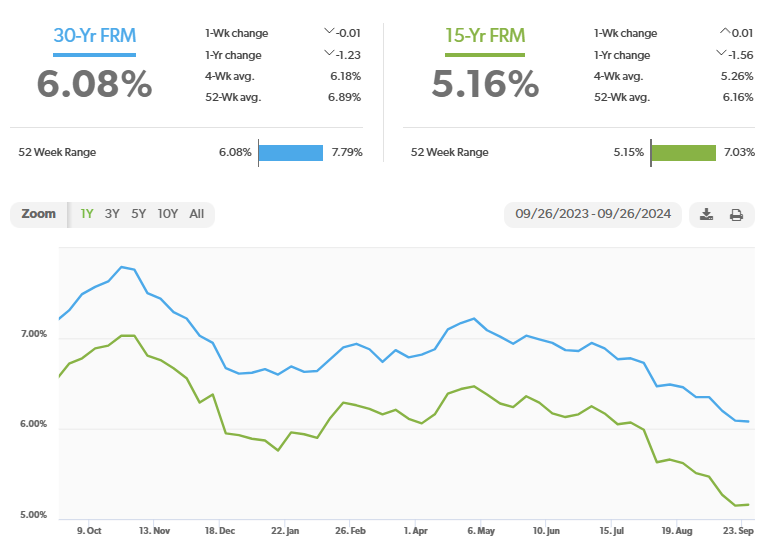
Mortgage rates – Every Thursday Freddie Mac publishes interest rates based on a survey of mortgage lenders throughout the week. The Freddie Mac Primary Mortgage Survey reported that mortgage rates for the most popular loan products as of September 26th, 2024, were as follows: The 30-year fixed mortgage rate was 6.08%, down from 6.35% at the end of August. The 15-year fixed was 5.16%, down from 5.51% last month.
The graph below shows the trajectory of mortgage rates over the past year.
Freddie Mac was chartered by Congress in 1970 to keep money flowing to mortgage lenders in support of homeownership and rental housing. Their mandate is to provide liquidity, stability, and affordability to the U.S.
Home sales data was released on the third week of the month for the previous month by the National Association of Realtors and the California Association of Realtors. These are August’s home sales figures.
U.S. existing-home sales August 2024 – The National Association of Realtors reported that existing-home sales totaled 3.86 million units on a seasonally adjusted annualized rate in August, down 4.2% from an annualized rate of 4.03 million last August. The median price for a home in the U.S. in August was $416,700, up 3.1% from $404,200 one year ago. There was a 4.2-month supply of homes for sale in August, up from a 3.3-month supply one year ago. First-time buyers accounted for 26% of all sales. Investors and second-home purchases accounted for 19% of all sales. All cash purchases accounted for 26% of all sales. Foreclosures and short sales accounted for 1% of all sales.
August California existing-home sales report – The California Association of Realtors reported that existing-home sales totaled 262,050 on an annualized rate in August, up 2.8% from a revised 254,820 homes sold on an annualized basis last August. The statewide median price paid for a home in July was $888,740, up 3.4% from $859,670. one year ago. There was a 3.2-month supply of homes for sale, up from a 2.4-month supply in August 2023.
The graph below lists home sales data by county in Southern California.