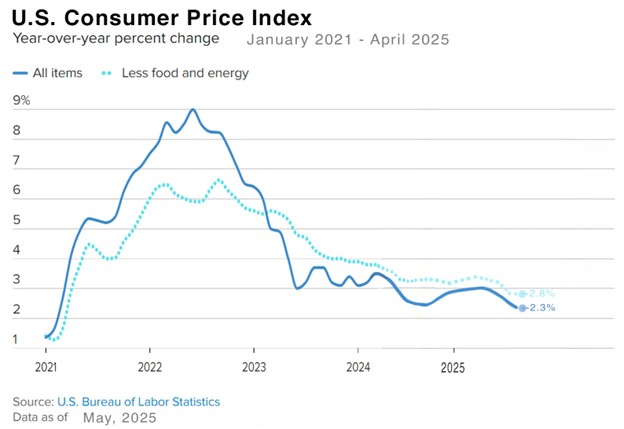
| Annual inflation rates have reached a four-year low – The Consumer Price Index (CPI) for April was released in May. The annual inflation rate in April dropped to 2.3%, its lowest rate since February 2021. Core CPI, which excludes volatile components like food and energy rose 2.8% year-over-year. The Producer Price Index was also released. Producer prices (wholesale prices) dropped 0.5% month-over-month in April, their largest monthly decline since 2006. Year-over-year producer prices were up 2.4% in April. The Personal Consumption Expenditures Price Index (PCE), rose 2.1% from last April. Core PCE rose 2.5% from last April. Unfortunately, the Fed and treasury bond investors are still leery of tariffs causing inflation to heat up. Both short-term and long-term interest rates are much higher than they should be with the current inflation rate.
The graph below shows the CPI rate since 2021
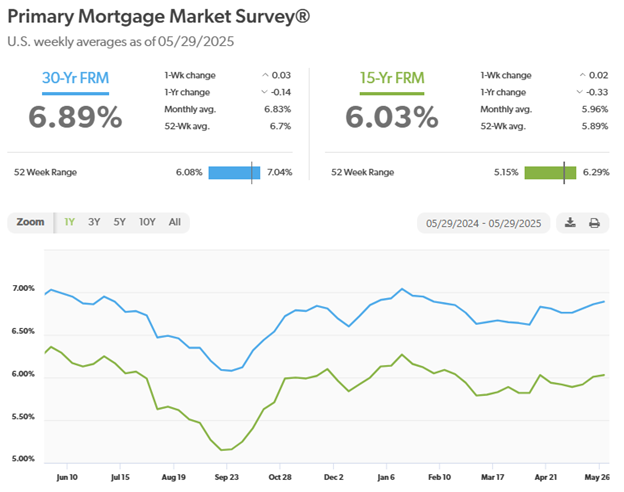
U.S. Treasury Bond Yields – Treasury bond yields jumped in May as investors worried that tariffs may ignite inflation. The 10-year U.S. treasury bond yield closed the month at 4.41%, up from 4.17% on April 30, 2025. The 30-year treasury yield ended the month at 4.92% , up from 4.66% on April 30, 2025. We watch bond yields because mortgage rates often follow treasury bond yields. Mortgage rates rose with treasury bonds in May – Every Thursday Freddie Mac publishes interest rates based on a survey of mortgage lenders throughout the week. The Freddie Mac Primary Mortgage Survey reported that mortgage rates for the most popular loan products as of May 29, 2025, were as follows: The 30-year fixed mortgage rate was 6.89%, up from 6.81% last month. The 15-year fixed was 6.03%, up from 5.94% last month. The graph below shows the trajectory of mortgage rates over the past year.
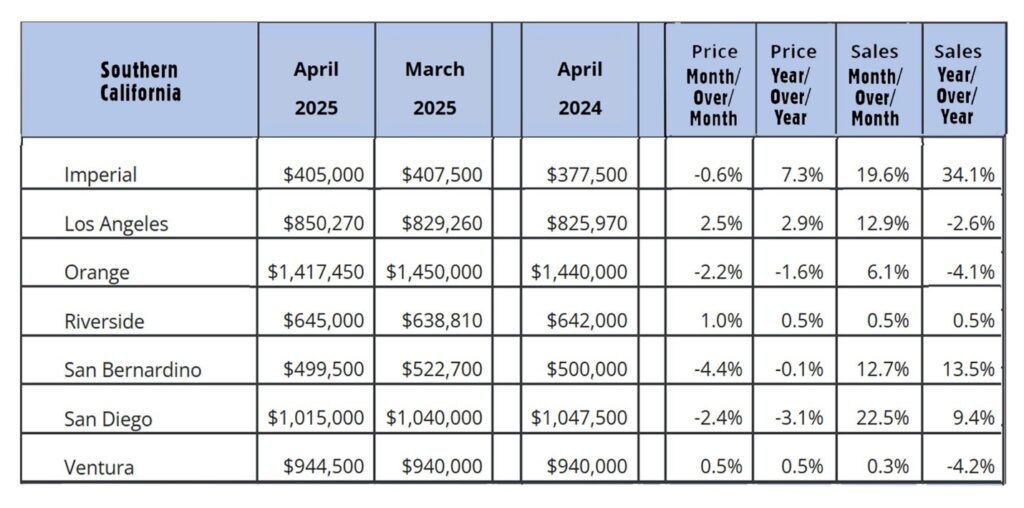
Stock markets rebounded in May. They have now made up almost all their losses from when the tariffs were announced at the beginning of April – The Dow Jones Industrial Average ended the year at 42,270.07, up 3.9% from 40,669.36 on April 30, 2025. The Dow is down 5.1% year-to-date. The S&P 500 closed the month at 5,911.69, up 6.1% from 5,569.06 on April 30, 2025. It is down 2.1% year-to-date. The NASDAQ closed at 19,113.77, up 9.6% from 17,446.34 on April 30, 2025. It is down 2.6% year-to-date. Home sales data is released on the third week of the month for the previous month by the California Association of Realtors and the National Association of Realtors. These are April’s home sales figures. U.S. existing-home sales April 2025 – The National Association of Realtors reported that existing-home sales totaled 4.00-million units on a seasonal annualized rate in April, down 2% from an annualized rate of 4.08 million units last April. The median price paid for a home sold in the U.S. in March was $414,000, up 1.8% from $406,600 one year ago. There was a 4.4-month supply of homes for sale in April, up from a 3.5-month supply in April 2024. First-time buyers accounted for 34% of all sales. Investors and second-home purchases accounted for 15% of all sales. All cash purchases accounted for 25% of all sales. Foreclosures and short sales accounted for 2% of all sales. California existing-home sales – The California Association of Realtors reported that existing-home sales totaled 267,710 on an annualized basis in April, down 3.4% from 277.0300 in March. Year-over-year sales were down 0.2% from a revised 268,170 annualized homes one year ago. The statewide median price paid for a home was $910,160 in April, up 0.2% from $904,010 last April. There was a 3.5-month supply of homes for sale in April, up from a 2.6-month supply of homes for sale last April. The graph below lists home sales data by county in Southern California.
|