| Interest rates dropped and stock markets rose for the fourth consecutive month in August – Fed Chair Jerome Powell spoke at the Jackson Hole Economic Policy Symposium in Wyoming. He noted that a weakening labor market “may warrant” interest rate cuts, sparking a strong rally in stock markets, and a drop in interest rates. The second quarter GDP was upgraded to a 3.3% increase in the second quarter of 2025. That’s a tremendous turnaround from a 0.5% drop in the January to March 2015 quarter. With stock markets at record highs, interest rates finally showing signs of dropping, and corporate profits strong, it will be interesting to see if the economy can continue growing now that the job market has begun to slow off its 50-year low unemployment rate.
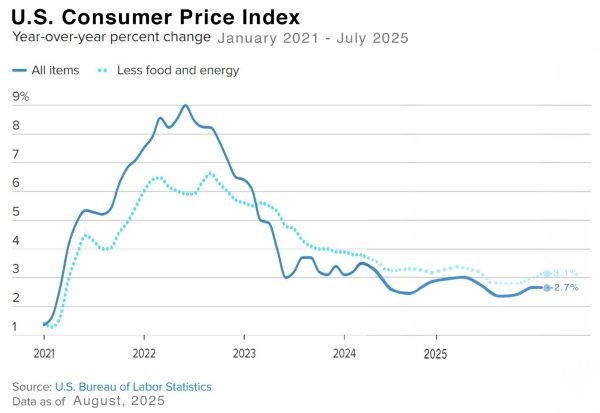
Consumer Inflation held steady while wholesale inflation jumped – The Consumer Price Index (CPI) for July showed that consumer prices rose 2.7% from one year ago, unchanged from June and below analysts’ expectations of a 2.8% increase. The core CPI rate, which excludes food and energy, rose 3.1% from one year ago, above the 3% forecast. While the CPI rate has gone up from 2.3% in April to 2.4% in May and 2.7% in June and July, that was not as much as economists expected due to tariffs. Unfortunately, the Producer Price Index (PPI) showed that wholesale prices increased 0.9% month-over-month in July, the highest monthly increase since June 2022. Year-over-year the increase was 3.3% for headline PPI and 3.7% for Core PPI. Wholesale inflation is usually a precursor to consumer inflation, as the increase in costs is later passed on to the consumer. The personal Consumption Expenditure Index (PCE), the Fed’s favorite gauge of inflation, showed that inflation grew at a 3.7% rate in July, unchanged from June. Core PCE grew at a 2.9% annual rate, up from 2.8% in June. So far we have seen some upward pressure on inflation but not to the extent that experts predicted. That could be because tariffs on many countries were delayed.
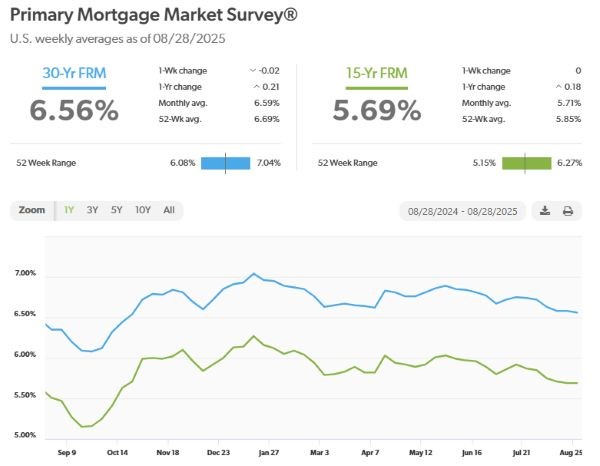
Stock markets ended the month at record highs- The Dow Jones Industrial Average ended the month at 45,554.86, up 3% from 44,230.98 on July 31, 2025. The Dow is up 2.2% year-to-date. The S&P 500 closed the month at 6,460.26, up 1.9% from 6,339.54 on July 31, 2025. It is up 7% year-to-date. The NASDAQ closed at 21,455.25, up 1.6% from 21,122.45 on July 31, 2025. It is up 9.3% year-to-date. U.S. Treasury Bond Yields – The 10-year U.S. treasury bond yield closed the month at 4.23%, down from 4.37% on July 31, 2025. The 30-year treasury yield ended the month at 4.92%, up from 4.89% on July 31, 2025. We watch bond yields because mortgage rates often follow treasury bond yields. Mortgage rates – Every Thursday Freddie Mac publishes interest rates based on a survey of mortgage lenders throughout the week. The Freddie Mac Primary Mortgage Survey reported that mortgage rates for the most popular loan products as of August 28, 2025, were as follows: The 30-year fixed mortgage rate was 6.56%, down from 6.72% last month. The 15-year fixed was 5.69%, down from 5.85% last month. The graph below shows the trajectory of mortgage rates over the past year.
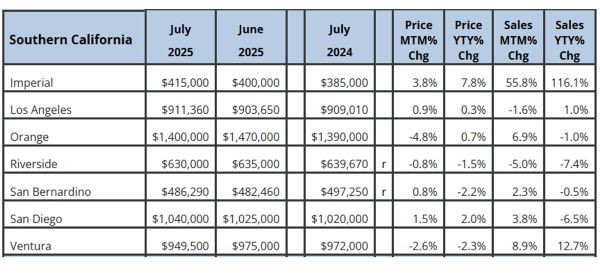
This week the California Association of Realtors and the National Association of Realtors released their July 2025 home sales report. You can run a report on your city or zip code with the same data at RodeoRe.com U.S. existing-home sales increased 2% in July after slowing in June – The National Association of Realtors reported that existing-home sales totaled 4.01 million units on a seasonally adjusted annualized rate in July, up from an annualized 3.93 million units in June. Year-over-year sales were up 0.8% from last July. The median price paid for a home sold in the U.S. in July was $422,400, down from $435,300 in June, and up 0.2% from $421,400 one year ago. There was a 4.6-month supply of homes for sale in June, up from a 4-month supply last July. First-time buyers accounted for 28% of all sales. Investors and second-home purchases accounted for 20% of all sales. All cash purchases accounted for 31% of all sales. Foreclosures and short sales accounted for 2% of all sales California existing-home sales – The California Association of Realtors (CAR) reported that existing-home sales totaled 261,810 on an annualized basis in July, down 1% from 264,000 in June. Year-over-year sales were down 4.1% from a revised 272,990 annualized home sales last July. The statewide median price paid for a home in was $884,050 in June, down 1.7% from $889,790 in June and down 0.3% from $886,420 in July 2024. There was a 3.7-month supply of homes for sale in July, up from a 2.9-month supply of homes for sale one year ago.
|
News & Media