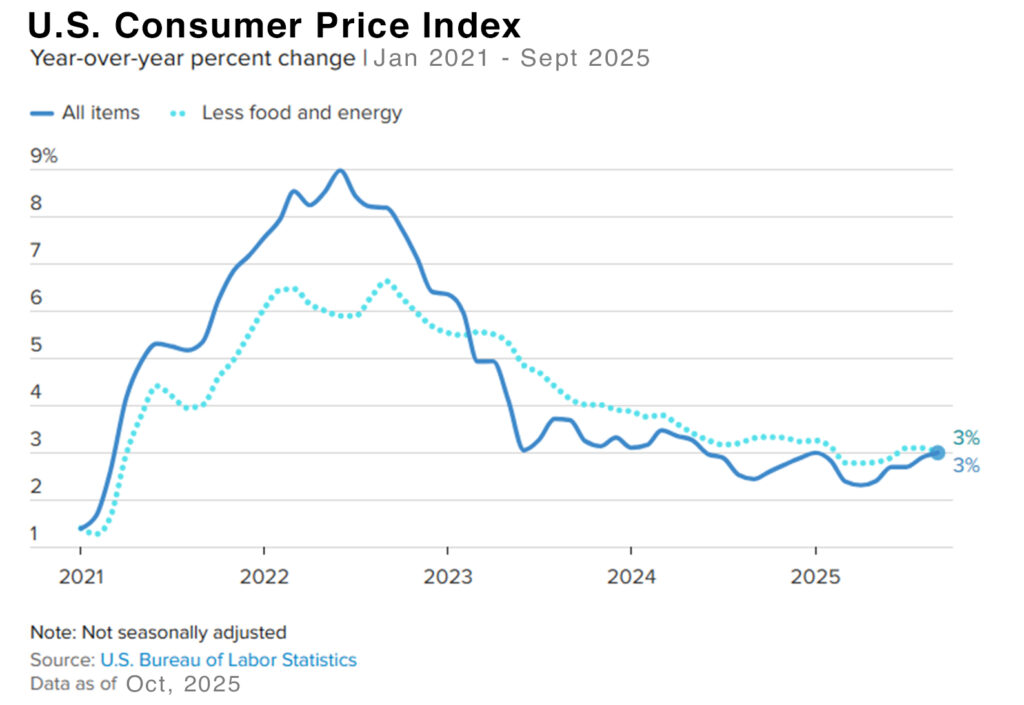
| Inflation is showing signs of leveling – On Friday, the Consumer Price Index (CPI) for September was released. It showed that consumer prices rose 3% from one year ago. The 3% CPI rate was the highest level since January 2025, but below analysts’ expectations of a 3.1% rise. The CPI rate dropped steadily after peaking at 9.1% in June 2022, its highest level since 1981. By April 2025, it had worked its way down to 2.3%. Experts felt that we were just months away from hitting the Fed’s 2% target, but when the administration began increasing tariffs, some of those tariffs were passed along to consumers, and the CPI rate began to steadily rise. Even though the CPI rate was the highest since January, investors felt good about the numbers, and stock markets ended the week at record levels. The Core CPI rate, which excludes food and energy rose 3% from one year ago as well, down from 3.1% in August. The CPI report was delayed due to the government shutdown. Other reports, like the September Jobs report, the Producer Price Index, and others are delayed indefinitely. The government called in furloughed government employees to complete the CPI report because it was needed to calculate the amount of the annual increase to social security payments. The increase was set at 2.8% after the CPI report was released.
The graph below shows the CPI rate since 2021 Interest rates – The Federal Reserve will conduct its Federal Open Market Committee (FOMC) next Tuesday and Wednesday. It is widely believed that they will reduce their key interest rates by ¼%. That’s pretty much built into the stock market prices. A larger drop will rally stocks a smaller increase could cause stock prices to drop. Stock Markets – Despite the government shutdown down stock markets closed the week at record highs. The Dow Jones Industrial Average closed the week at 47,207.12, up 2.2% from 46,190.61 last week. Year-to-date, it is up 6% from 44,544.66 on December 31, 2024. The S&P 500 closed the week at 6,791.69, up 1.9% from 6,664.01 last week. Year-to-date, the S&P is up 12.4% from 6,040.53 on December 31, 2024. The Nasdaq closed the week at 23,204.87, up 2.3% from 22,679.98 last week. Year-to-date, it is up 18.2% from 19,627.44 on December 31, 2024. U.S. Treasury bond yields – The 10-year treasury bond closed the week yielding 4.02%, unchanged from 4.02% last week. The 30-year treasury bond yield ended the week at 4.59% almost unchanged from 4.60% last week. We watch bond yields because mortgage rates follow bond yields. Mortgage rates – Every Thursday, Freddie Mac publishes interest rates based on a survey of mortgage lenders throughout the week. The Freddie Mac Primary Mortgage Survey reported that mortgage rates for the most popular loan products as of October 23, 2025, were as follows: The 30-year fixed mortgage rate was 6.19%, down from 6.27% last week. The 15-year fixed was 5.44%, down from 5.52% last week. The graph below shows the trajectory of mortgage rates over the past year. U.S. existing-home sales – September 2025 – The National Association of Realtors reported that existing-home sales totaled 4.06 million units on a seasonally adjusted annualized rate in September, up 1.3% from 4.0 million homes on an annualized rate sold in August and up 4.1% from the number of homes sold last September. The median price paid for a home sold in the U.S. in September was $415,200, down 1.75% from $422,600 in August but up 2.1% from $406,700 one year ago. There was a 4.6-month supply of homes for sale in September, up from a 4.2-month supply last September. First-time buyers accounted for 30% of all sales, up from 28% last month. Investors and second-home purchases accounted for 15% of all sales, down from 21% in August. All cash purchases accounted for 30% of all sales, up from 28% last month. Foreclosures and short sales accounted for 2% of all sales Have a Great Weekend! |
News & Media