| The Federal Reserve began its cycle of rate cuts with the first rate cut in four years – Declaring that inflation has come under control, the Fed dropped its key rates by ½% on Wednesday. With inflation spiking bringing the CPI to 9.1% in June 2022 the Fed enacted one of the most aggressive rate hike campaigns in history. They increased rates steadily until they hit a 25-year high. Now that the CPI has worked its way down, it measured 2.5% in August, the Fed has begun a campaign of dropping rates to a more “neutral rate” from their previous “restrictive rate.” Experts expect two more drops before the end of the year, likely .25% each. Next Friday we will get the Personal Consumption Expenditures (PCE) report, a gauge of inflation that is a Fed favorite. One week from Friday we will get the September Jobs report. Those reports will have an impact on bond yields and mortgage rates which did not drop after the Fed announced their rate drop. That drop was expected and was already “built into” long-term bond yields and mortgage rates.
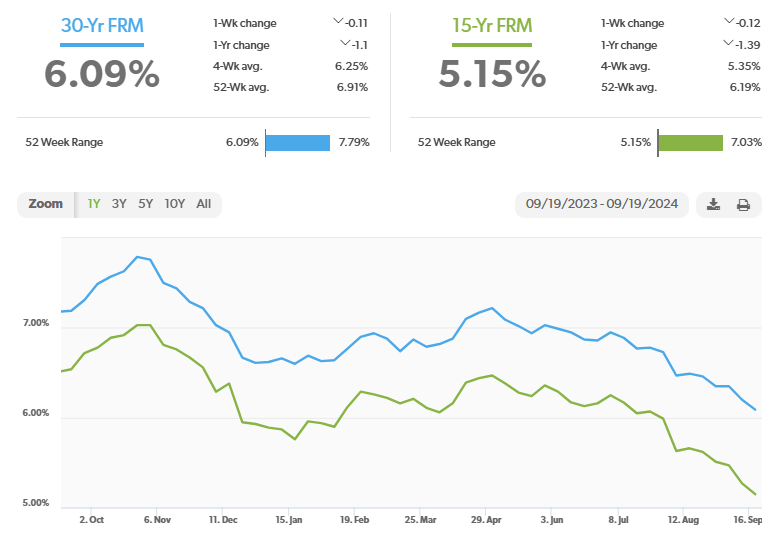
Stock markets – The Dow Jones Industrial Average closed the week at 42,063.36, up 1.6% from 41,393.78 last week. It is up 11.6% year-to-date. The S&P 500 closed the week at 5,702.55, up 1.4% from 5,626.78 last week. The S&P is up 19.6% year-to-date. The Nasdaq closed the week at 17,948.32, up 1.5% from 17,683.98 last week. It is up 19.6% year-to-date. U.S. Treasury bond yields up slightly this week – The 10-year treasury bond closed the week yielding 3.73%, up from 3.66% last week. The 30-year treasury bond yield ended the week at 4.07%, up from 3.93% last week. We watch bond yields because mortgage rates follow bond yields. Mortgage rates – Every Thursday Freddie Mac publishes interest rates based on a survey of mortgage lenders throughout the week. The Freddie Mac Primary Mortgage Survey reported that mortgage rates for the most popular loan products as of September 19, 2024, were as follows: The 30-year fixed mortgage rate was 6.09%, down from 6.2% last week. The 15-year fixed was 5.15%, down from 5.27% last week. The graph below shows the trajectory of mortgage rates over the past year
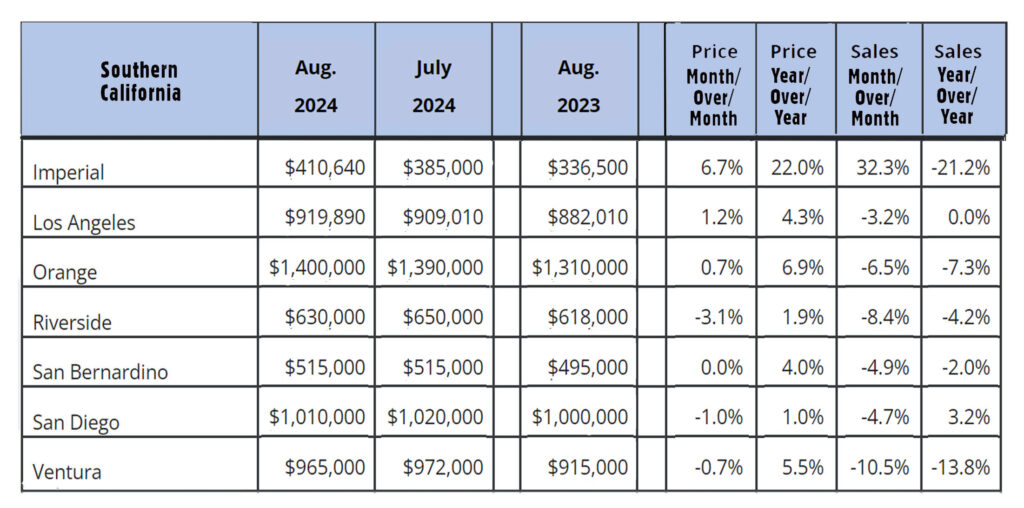
Freddie Mac was chartered by Congress in 1970 to keep money flowing to mortgage lenders in support of homeownership and rental housing. Their mandate is to provide liquidity, stability, and affordability to the U.S. Home sales data is released on the third week of the month for the previous month by the National Association of Realtors and the California Association of Realtors. These are August’s home sales figures. U.S. existing-home sales August 2024 – The National Association of Realtors reported that existing-home sales totaled 3.86 million units on a seasonally adjusted annualized rate in August, down 4.2% from an annualized rate of 4.03 million last August. The median price for a home in the U.S. in August was $416,700, up 3.1% from $404,200 one year ago. There was a 4.2 months’ supply of homes for sale in August, up from a 3.3 months’ supply one year ago. First-time buyers accounted for 26% of all sales. Investors and second-home purchases accounted for 19% of all sales. All-cash purchases accounted for 26% of all sales. Foreclosures and short sales accounted for 1% of all sales. August California existing-home sales report – The California Association of Realtors reported that existing-home sales totaled 262,050 on an annualized rate in August, up 2.8% from a revised 254,820 homes sold on an annualized basis last August. The statewide median price paid for a home in July was $888,740 , up 3.4% from $859,670. one year ago. There was a 3.2 months’ supply of homes for sale, up from a 2.4-months’ supply in August 2023. The graph below lists home sales data by county in Southern California.
Have a great weekend! |
News & Media