| The Federal Reserve cut rates in September – Fed Chairman Powell announced that the Fed had reduced its key interest rate by 0.25%, the first rate cut of the year. The Fed rate is the overnight rate that banks pay to borrow from the Fed, the shortest of short-term rates. When the Fed lowers its rate, banks typically follow with an equal reduction in their prime rate. That affects business lines of credit, home equity lines of credit, and other short-term loans. However, it does not necessarily bring down mortgage rates or long-term bond yields. In fact, both rose slightly after the rate cut, though they remain near their lowest levels of 2025.
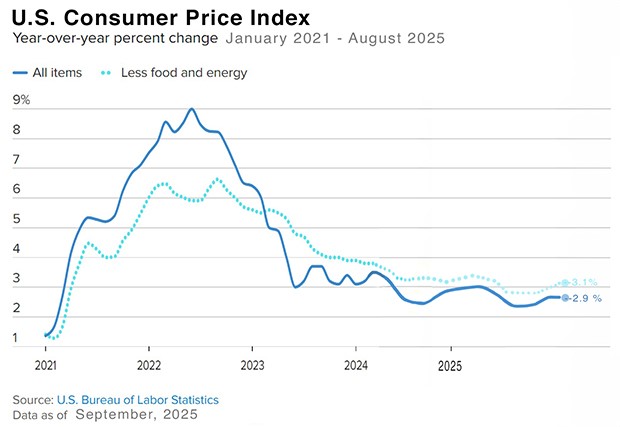
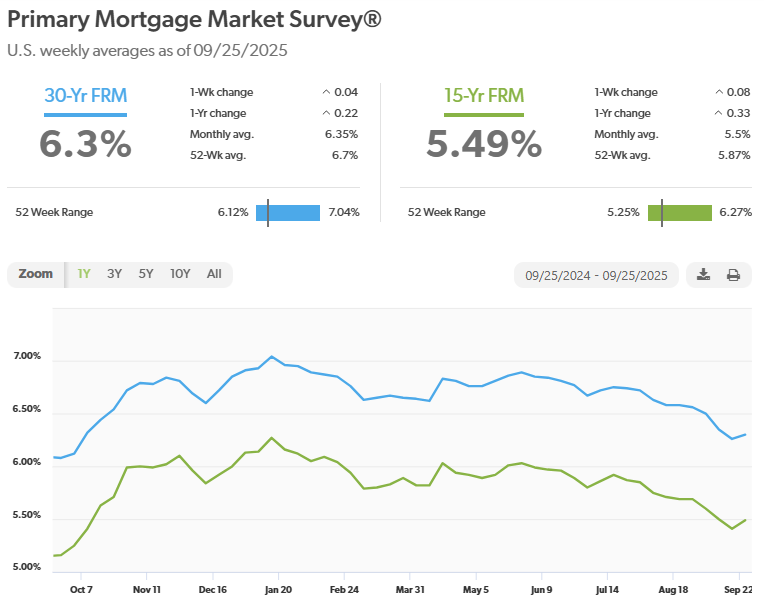
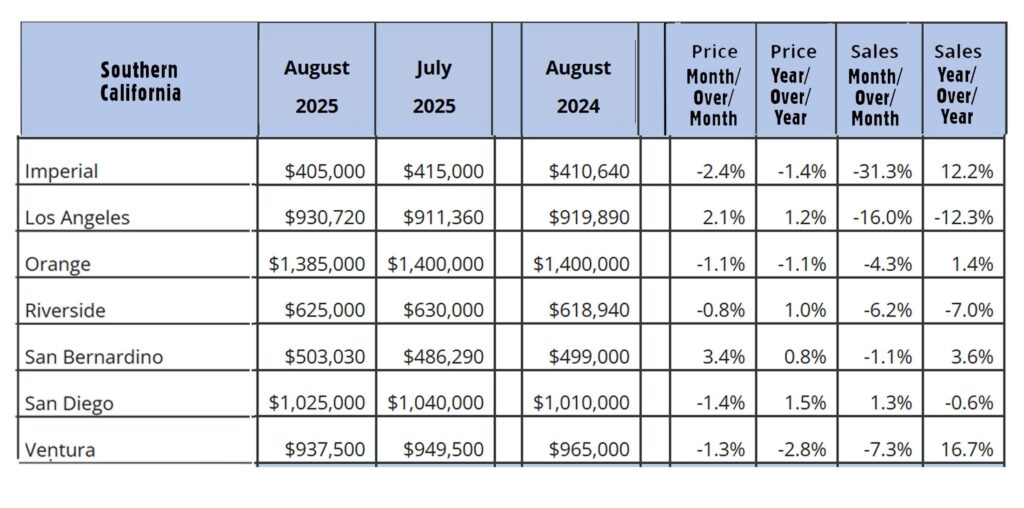
September releases show that inflation continued to creep up in August – The Consumer Price Index (CPI) for August showed that consumer prices rose 2.9% from one year ago, up from a 2.7% annual increase in July, but in line with analysts’ expectations. The CPI rate bottomed out at 2.3% in April but has risen steadily. This rise has been attributed to tariffs by both the Fed and economists. The core CPI rate, which excludes food and energy, rose 3.1% from one year ago, unchanged from July’s 12-month increase. Investors tend to look at Core CPI more than headline CPI because food and energy prices fluctuate in a more volatile manner, so remaining flat was viewed positively. The Producer Price Index (PPI) was released on Wednesday. Wholesale prices declined 0.1% for the month in August. This was a big relief to the markets after July’s 0.7% month-over-month increase. Year-over-year headline PPI was up 2.6% in August, down from an annual 3.3% increase in July. Core PPI showed wholesale prices were up 2.8% from one year ago, down from an annualized 3.7% in July. Wholesale inflation is usually a precursor to consumer inflation, as the increase in costs is later passed on to the consumer. The Personal Consumption Expenditures Index (PCE) rose 2.7% in August, up from 2.6% in July. Core PCE rose 2.9% from one year ago. The graph below shows the trajectory of the Consumer Price Index since 2021. Stock markets ended the month at record highs- The Dow Jones Industrial Average ended the month at 46,397.86, up 1.9% from 45,544.86 on August 30, 2025. The Dow is up 4.2% year-to-date. The S&P 500 closed the month at 6,688.46, up 3.5% from 6,460.26 on August 30, 2025. It is up 10.7% year-to-date. The NASDAQ closed at 22,660.01, up 5.6% from 21,455.25 at the end of August. It is up 15.5% year-to-date. U.S. Treasury Bond Yields – The 10-year U.S. Treasury bond yield closed the month at 4.16%, down from 4.23% on August 30, 2025. The 30-year treasury yield ended the month at 4.73%, down from 4.92% on August 30, 2025. We watch bond yields because mortgage rates often follow treasury bond yields. Mortgage rates – Every Thursday Freddie Mac publishes interest rates based on a survey of mortgage lenders throughout the week. The Freddie Mac Primary Mortgage Survey reported that mortgage rates for the most popular loan products as of September 25, 2025, were as follows: The 30-year fixed mortgage rate was 6.30%, down from 6.56% last month. The 15-year fixed was 5.49%, down from 5.69% last month. The graph below shows the trajectory of mortgage rates over the past year. August home sales – This week, the California Association of Realtors and the National Association of Realtors released their August 2025 home sales report. You can run a report on your city or zip code with the same data at RodeoRe.com. U.S. existing-home sales – August 2025 – The National Association of Realtors reported that existing-home sales totaled 4.0 million units on a seasonally adjusted annualized rate in August, up 1.8% from the number of homes sold last August. The median price paid for a home sold in the U.S. in August was $422,600, down from $435,300 in July, and up 0.2% from $414,200 one year ago. There was a 4.6-month supply of homes for sale in August, up from a 4.2-month supply last August. First-time buyers accounted for 28% of all sales. Investors and second-home purchases accounted for 21% of all sales. All cash purchases accounted for 28% of all sales. Foreclosures and short sales accounted for 2% of all sales California existing-home sales – The California Association of Realtors reported that existing-home sales totaled 264,240 on an annualized basis in August, up 0.9% from 261,820 in July. Year-over-year sales were down 0.2% from a revised 264,640 annualized home sales last August. The statewide median pric e paid for a home was $899,140 in August, up 1.2% from $888,740 in August 2024. The unsold inventory index showed that there was a 3.9-month supply of homes for sale in August, down from a 3.2-month supply of homes for sale one year ago. The graph below shows CAR sales data by county for Southern California.
|
News & Media