Technology keeps nudging everyday life into new rhythms — smarter discovery, pocketable cameras, phone-first identity, and subtle UX wins for creators. Check out what moved the needle this week in the world of technology with our weekly round-up. From Snapchat Bitmojis to Apple Digital ID and more, we have covered with the top headlines you need to know!
LinkedIn’s AI people-search helps you find the right contact by description

LinkedIn launched an AI people-search tool that lets users find professionals by natural-language descriptions — for example, “Northwestern alumni in entertainment marketing” — instead of relying solely on exact names or rigid job titles. The feature weights relevance by your network connections and is rolling out to Premium users in the U.S. first, with broader availability planned. For recruiters, partnerships teams, and marketers, this reduces manual sleuthing and surfaces warm intros faster, improving outreach quality. It also nudges LinkedIn further from static profiles toward an AI-assisted discovery layer that understands intent and context. Expect privacy and accuracy conversations as networked people-search becomes a standard workflow for talent and business dev.
DJI’s Neo 2 selfie drone goes global — just not (yet) in the U.S.

DJI introduced the Neo 2, a compact selfie drone designed for quick social clips with automated tracking and easy editing flows, and announced global launches in many regions while holding off on a U.S. launch for now. The Neo 2 prioritizes portability and simplicity: creators can capture stabilized aerial footage without hauling pro rigs, then jump straight into basic edits. DJI’s decision to delay U.S. availability highlights continuing regulatory and safety hurdles that shape hardware rollouts for consumer aircraft. For creators outside the U.S., the Neo 2 looks like a compelling pocketable tool; for U.S.-based creators, it’s a reminder that access depends on local rules, not just product readiness. Either way, small drones are getting finessed to be more creator-friendly and less fiddly.
Apple’s Digital ID wins TSA acceptance for select checkpoints
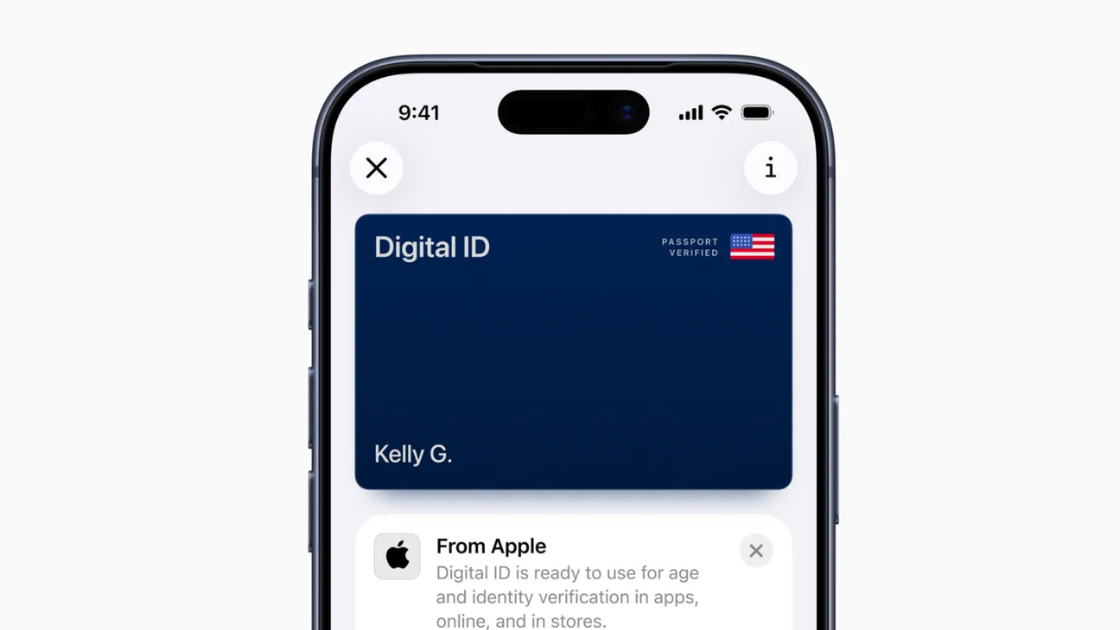
Apple’s Digital ID in Wallet gained acceptance from the TSA for participating checkpoints. Likewise, the acceptance of Apple’s Digital ID lets travelers present verified identity documents from their phones instead of paper IDs. Of course, this will only be accepted where the program is supported. The system emphasizes device-based security and user control. Digital ID credentials are encrypted and presented by the user at the point of inspection rather than being uploaded to a central server. Early agency adoption signals growing institutional trust in certified Digital ID usage, but support will expand gradually as other agencies and venues onboard. For frequent travelers, the feature offers the convenience of shorter lines and fewer physical documents. Watch for Digital ID adoption by airports, state agencies, and transit systems to understand when it becomes broadly useful.
Aqara’s FP300 Presence sensor promises long battery life and Matter/Thread support

Aqara introduced the FP300 Presence multi-sensor, a compact Zigbee/Matter/Thread device designed to detect presence and motion while claiming multi-year battery life under typical use. The sensor pairs low-power operation with industry-standard protocols so it can slot into modern smart-home setups without frequent battery swaps. That combination makes presence detection more practical for automations like lights, HVAC, and occupancy routines while avoiding the annoyance of constant maintenance. Buyers will want to confirm local processing options and privacy practices, since always-on presence features raise legitimate data concerns. Overall, the FP300 is a pragmatic push toward more reliable, lower-hassle home automation.
Google Photos’ “Help me edit” lands on iOS to fix images by description
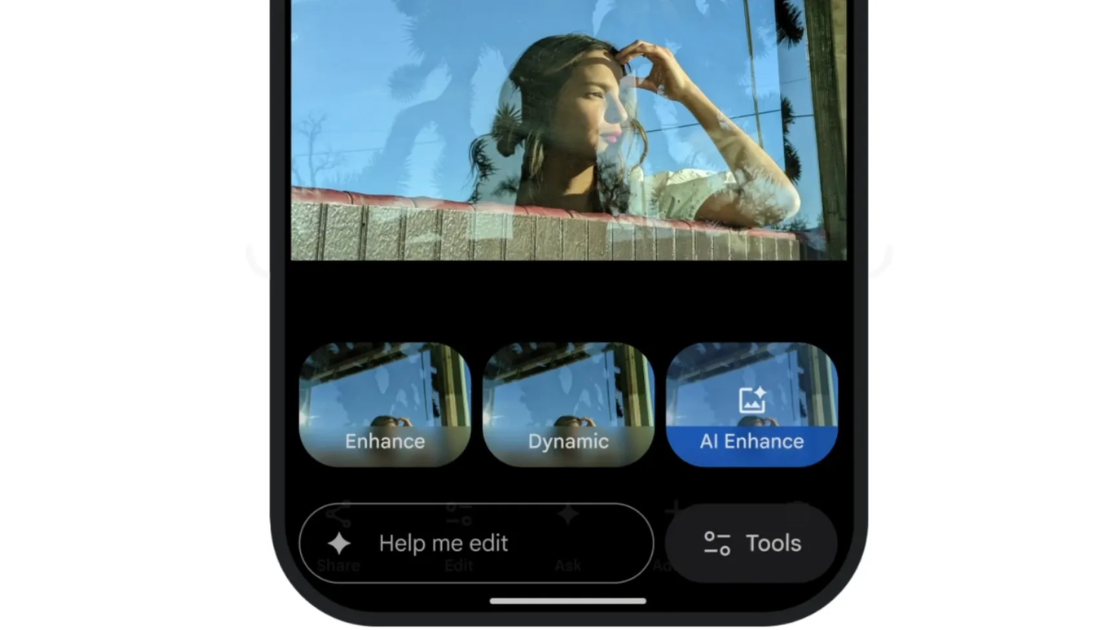
Google Photos added “Help me edit” on iOS, where users can type a natural-language instruction like “make the sky moodier and brighten the subject” and get suggested edits that apply exposure, color, and crop tweaks automatically. The feature is aimed at creators who want fast, consistent retouching without diving into a full editor — a quick way to turn a decent photo into a social-ready image. Advanced users can still fine-tune the results, but for many people, the conversational workflow speeds up the edit loop significantly. The update leans on Google’s image models and UX polish to make editing feel like asking a helpful friend for a touch-up. Expect ongoing improvements to fidelity and context understanding as the tool learns from more varied instructions.
Snapchat revives 2D Bitmojis with a comic-style refresh for subscribers

Snapchat reintroduced a comic-inspired 2D Bitmoji aesthetic for subscribers this week. The feature will be for those who prefer the illustrated look over the platform’s more photoreal 3D avatars. The comeback is a win for creators and communities that use avatar styling as a core part of identity and branding, offering a clearer, more graphic expression across Stories and ads. Snapchat positions the change as customization and nostalgia — letting users choose the visual language that best fits their social voice. The update is small in scope but meaningful in practice. Likewise, avatar style impacts tone, readability, and how audiences relate to creators. Expect more avatar customization options and monetizable styling bundles aimed at power users.