Inflation led the markets in 2023 – We began the year with the inflation rate at 6.5%, down from its peak of 9.1% in June of 2022. The inflation rate was 3.2% in November and many experts feel that December will be lower. That figure will be released in January. After nearly two years of rising interest rates, the Fed shifted course in December. They announced that their efforts to tame inflation were working and that they felt that the trajectory of inflation is expected to continue to drop. Their guidance for 2024 is that they expect to drop rates three times. With the Fed Fund Rate at a 23-year high that was welcome news to investors.
Stock markets soared in 2023 – Stock markets had a banner year. The Dow and S&P approached their record highs set in 2021, while the NASDAQ gained over 43%, yet is still well off its highs of 2021. It has been a strange two years. In 2022 when inflation began to rise to 40-year highs, the Fed began raising interest rates to slow the economy. Most experts felt that these steep interest rate increases would throw the country into a recession and stocks had one of their worst years in 2022, with steep losses. As the Fed kept increasing rates, employers kept hiring, and the unemployment rate remained at or near 60-year lows. With a shortage of employees’ wages increased above the rate of inflation. With the job market so strong consumers kept sending at record levels. Consumer spending accounts for 2/3 of the U.S. economy. Not only did a recession not materialize, but the economy grew at a high rate. The GDP, the broadest gage of economic output, was up 2.0% in Q1, 2.1% in Q2 and 4% in the fourth quarter. That’s above the long-term average of 3.19%. The fourth quarter GDP figure will be released in January. The outlook for 2024 is strong. The Dow Jones Industrial Average ended the year at 37,689.40, up 13.7% from 33,147.25 on December 31, 2021. The S&P 500 closed the year at 4,769.89, up 24.2% from 3,839.50 on December 31, 2022. The NASDAQ closed at 15,011.35, up 43.4% from 10,466.48 at the end of 2022.
U.S. Treasury Bond Yields rise 2022 – The 10-year U.S. treasury bond yield closed the year at 3.88%, up from 3.88% On December 31, 2022. It went over 5% in October, but fell in November and December. It was 1.52% on December 31, 2021. The 30-year treasury yield ended the year at 3.97%, up from 3.97% on Dec. 31, 2022. It hit 5% in October, before falling in the last two months. It was 1.90% on December 31, 2021. We watch bond yields because mortgage rates often follow treasury bond yields.
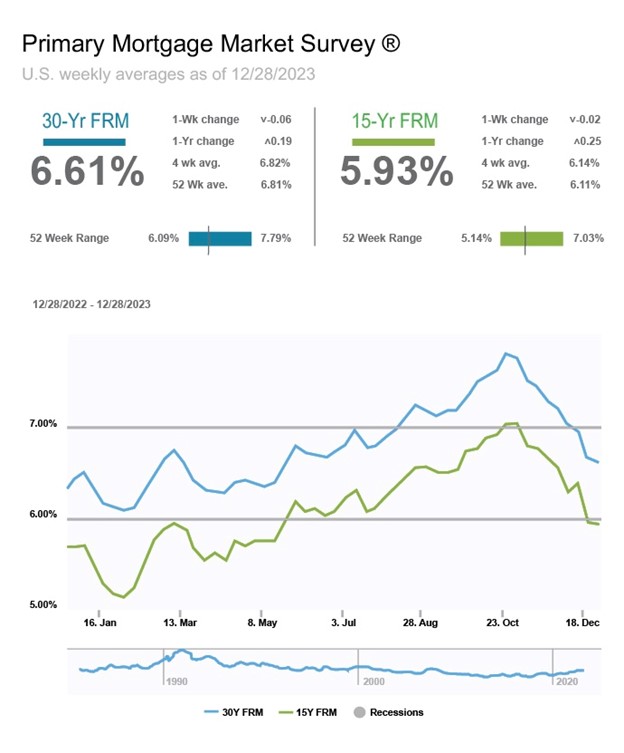
Mortgage Rates – It was a turbulent year for mortgage rates. The year began with rates in the mid 6% range, but they rose sharply in September and October, before ending the year back to where they began. Fortunately, with inflation taming it appears that rates will continue to drop in 2024. The December 28, 2023 Freddie Mac Primary Mortgage Survey reported that the 30-year fixed rate mortgage average was 6.61%, up from 6.42% on December 29, 2022. The 30-year peaked at 8% in October, before dropping sharply in November and December. It was 3.11% on December 28, 2021. The 15-year fixed was 5.93%, up from 5.68% last December. The graph below shows the trend of mortgage rates over the last year.
U.S. existing-home sales – The National Association of Realtors reported that existing-home sales totaled 3.82 million units on a seasonally adjusted annualized rate in November, down 7.3% from an annualized rate of 4.12 million in November 2022. The median price for a home in the U.S. in November was $387,600, up 4% from $372,700 last November. There was a 3.5-month supply of homes for sale in November, up from a 3.3-month supply last November. First-time buyers accounted for 31% of all sales. Investors and second-home purchases accounted for 14% of all sales. All-cash purchases accounted for 29% of all sales. Foreclosures and short sales accounted for 1% of all sales.
Home sales hit an all-time low in 2023 – California Association of Realtors November existing-home sales report – The California Association of Realtors reported that existing-home sales totaled 223,940 units on a seasonally adjusted annualized basis in November, down 7.4% from October. November marked the third straight month of the annualized sales rate dropping under 250,000, a level that was thought could never happen, and the 29th straight month of year-over-year declines in sales. Year-to-date, the number of homes sold was down 25.9% in November. Prior to 2022 home sales have rarely dropped below 400,000 in decades. They will end the year somewhere around 250,000. While historically interest rates are not that high, compared to the lowest rates in 50-years during COVID the shock of going from the lowest rates in decades to the highest rates in 23-years has caused many potential home sellers to put off their move. In a normal year about 50% of sales are what we call move-up buyers. Those are people selling a home to purchase another. When your mortgage is at a 3% rate, it’s difficult to sell it and purchase another with a mortgage at a 7% rate. For example, if you own a $2 million dollar home with a $1 million mortgage at 3%, your payment with taxes and insurance is about $4,500. If you put your $1 million in equity down on your new $4 million dollar home and obtained a $3 million loan at 6.5% (down from almost 8% two months ago) your payment with tax and insurance would be around $24,000 a month. That’s a big jump and has caused many people to stay in their current home that would normally move to a new home. When people put off their move it reduces the number of homes for sale. This is exactly what is happening now. The statewide median price paid for a home in November was $822,200, up 6.2% from a revised $774,150 a year ago. There was a 3-month supply of homes on the market, up from a 2.7-month supply of homes for sale in October, and down from a 3.2-month supply one year ago.
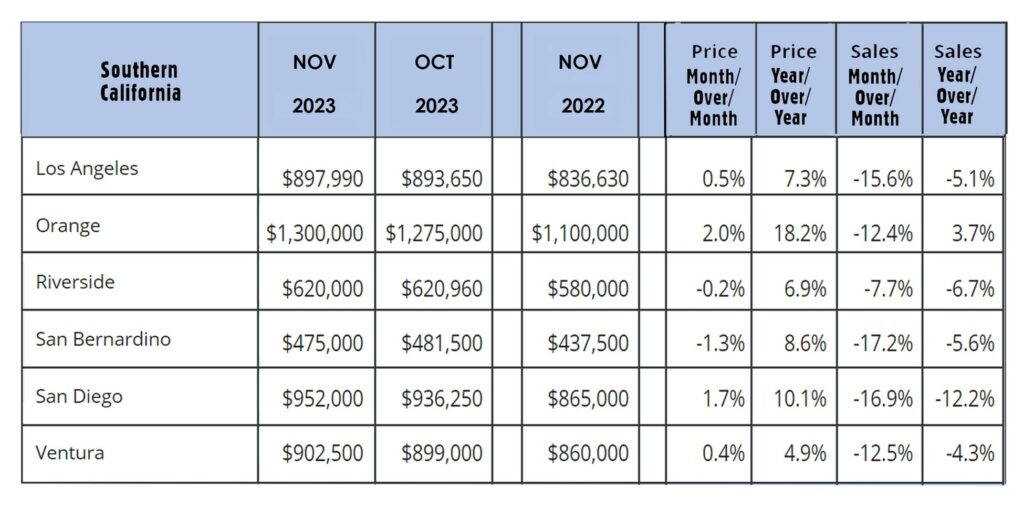
The graph below shows sales data by county in Southern California.