Stock markets began the year higher – With a renewed sense of optimism this January was very different than January 2023. With the Fed in the middle of an aggressive rate hike campaign in order to tame inflation many people felt that a recession was inevitable in 2023. This year things are different. The Fed made an unprecedented 11 rate hikes in just over 13 months. That pushed the overnight rate from near 0% to 5.5%, and the Pime Rate, a rate that many business loans are tied to, from 3.5% to 8.5%. In 2024 we now know that we not only did not have a recession in 2023, but that the economy grew by 2.5% for the year, up from 1.9% in 2022. In fact, after starting the year with almost no growth, the economy grew 4.9% in the third quarter and 3.3% in the fourth quarter as strong economic date kept being released. The Fed has stated that they are done raising rates and plan to began cutting this year as inflation has come down to more acceptable levels. While we don’t expect to see the historic low rates we saw during the pandemic, we do expect to see rates drop in the coming years to more affordable levels. The Dow Jones Industrial Average closed the month at 38,150.30, up 1.2% from 37,689.40 on December 31, 2023. The S&P 500 closed the month at 4,845.65, up 1.5% from 4,769.89 last month. The NASDAQ closed the month at 15,164.01, up 1% from 15,011.35 last month.
U.S. Treasury bond yields – The 10-year treasury bond closed the month yielding 3.99%, up from 3.88% last month. The 30-year treasury bond yield ended the month at 4.22%, up from 4.03% last month. We watch bond yields because mortgage rates often follow treasury bond yields.
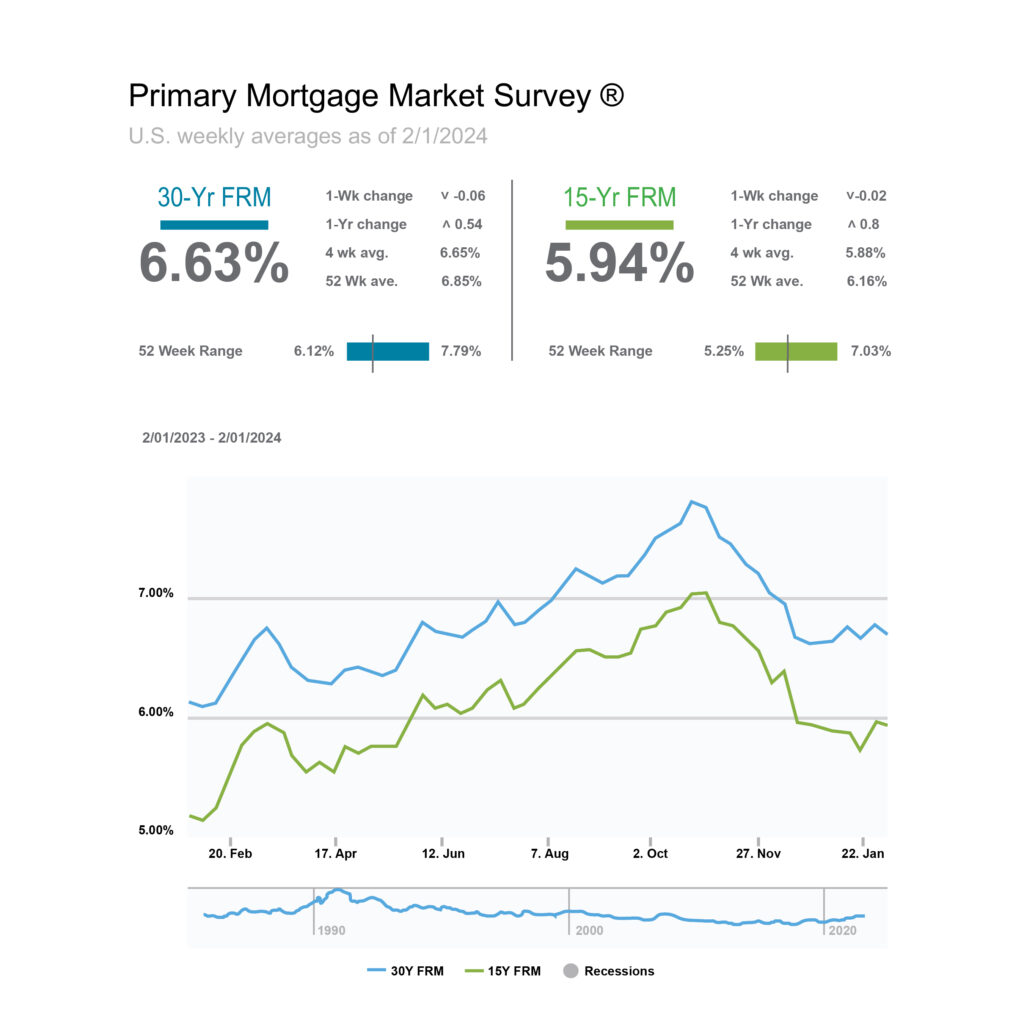
Mortgage rates – The Freddie Mac Primary Mortgage Survey reported that mortgage rates as of February 1st, 2024, for the most popular loan products were as follows: The 30-year fixed mortgage rate was 6.63%, almost unchanged from 6.61% at the end of December. The 15-year fixed was 5.94%, almost unchanged from 5.93% at the end of December.
Home sales data is released on the third week of the month for the previous month by the National Association of Realtors and the California Association of Realtors. These are December’s home sales figures.
U.S. existing-home sales – The National Association of Realtors reported that existing-home sales totaled 3.78 million units on a seasonally adjusted annualized rate in December, down 6.2% from an annualized rate of 4.03 million in December 2022. The median price for a home in the U.S. in December was 382,600, up 4.4% from $366,500 last December. There was a 3.2-month supply of homes for sale in December, up from a 2.9-month supply last December. First-time buyers accounted for 29% of all sales. Investors and second-home purchases accounted for 16% of all sales. All-cash purchases accounted for 29% of all sales. Foreclosures and short sales accounted for 2% of all sales. In 2023, 4.09 million existing-homes sold, the lowest level since 1995, while the median price reached a record high level of $389,800. Existing-homes include single-family, condominium, townhomes, and co-ops.
California Association of Realtors 2023 existing-home sales report – The California Association of Realtors reported that existing-home sales totaled 224,000 units on a seasonally adjusted annualized basis in December, down 7.1% from a revised 241,700 homes sold on an annualized basis last December. California recorded 257,560 existing-homes sold in 2023, down from 342,530 homes sold in 2022. That marked the biggest one-year drop in annual sales since 2007. Prior to 2022 home sales have rarely dropped below 400,000 in decades. Much of the decline was due to a loss of move-up buyers. Normally about 60% of all sales are people that sell a home and use their proceeds to purchase another. When someone that wants to move has a mortgage rate at a 3% it’s difficult to sell it and purchase another with a mortgage at a 7% rate. This is because when they own a $2 million dollar home with a $1 million mortgage at 3%, their payment with taxes and insurance is about $4,500 a month. If they put their $1 million in proceeds down on a new $4 million dollar home and obtained a $3 million loan at 6.5% (down from almost 8% two months ago) their payment with tax and insurance would be around $24,000 a month. That’s a big jump that has caused many people to stay in their current home that would normally move to a new home. When people put off their move it reduces the number of homes for sale. There was a 2.5-month supply of homes on the market in December, down from 3-month supply of homes for sale in November, and a 2.6-month supply one year ago. That marked the tightest inventory level in 7 months. Fewer homes for sale, especially in a first-time buyer price range pushes prices up for those homes. This is exactly what is happening now. At the same time, without the move-up buyers, homes in the upper ranges of many areas are sitting. Those are being reduced and selling for less than they did in 2022. Because there are many more sales in the lower price range than the upper price ranges the median price, the point at which 1/2 the homes sell for mom and 1/2 sell for less, is moving up. The statewide median price paid for a home in December was $819,740, up 6.4% from a revised median price of $770,490 a year ago. In the field we are not seeing home prices increase in the upper price ranges the way we are seeing the first-time purchaser home prices jump.
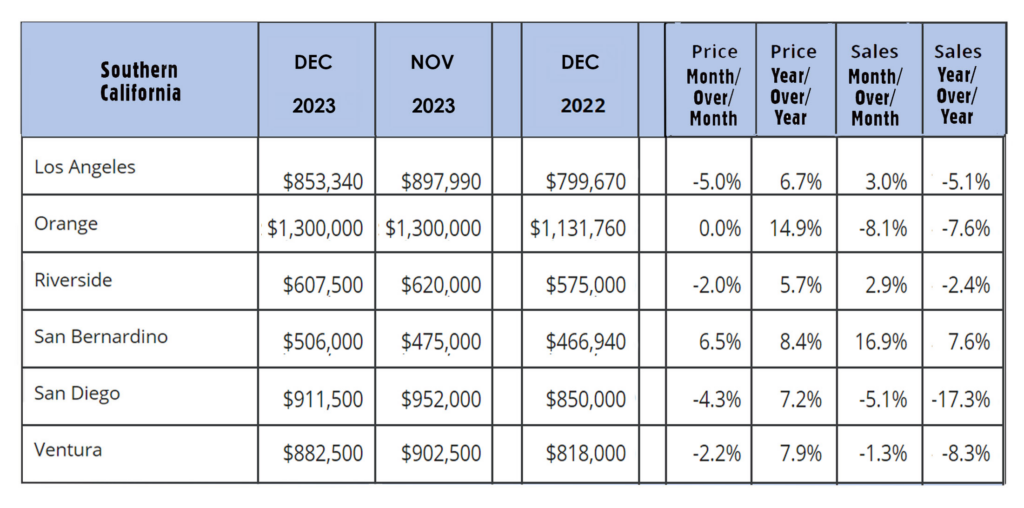
The graph below shows home sales figures by county in Southern California.