Economic news this week – On Thursday it was announced that the U.S. economy grew at a solid 3.4% annual pace in the last quarter of 2023, up from a previously estimated rate of 3.2%. The PCE (personal consumption expenditures) index, the Fed’s favorite gauge of inflation, was released on Friday. It showed that the core PCE increased 2.8% year-over-year. That was in line with analysts’ expectations.
Stock markets – The Dow Jones Industrial Average closed the week at 39,807.37, up 0.8%from 39,475.90 last week. It is up 5.6% year-to-date. The S&P 500 closed the week at 5,254.35, up 0.4% from 5,234.18 last week. The S&P is up 10.2% year-to-date. The Nasdaq closed the week at 16,379.46 down 0.3% from 16,428.82 last week. It is up 9.1% year-to-date.
U.S. Treasury bond yields – The 10-year treasury bond closed the week yielding 4.22%, down from 4.31% last week. The 30-year treasury bond yield ended the week at 4.39%, down from 4.43% last week. We watch bond yields because mortgage rates follow bond yields.
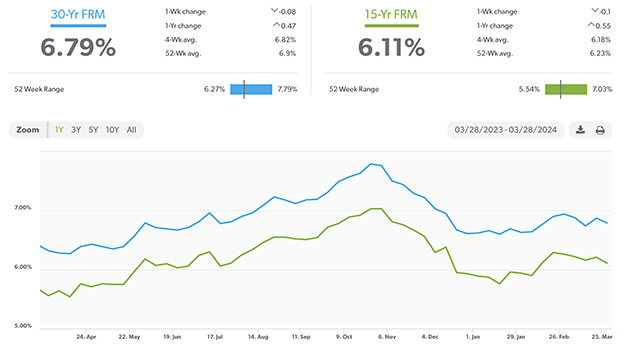
Mortgage rates – Every Thursday Freddie Mac publishes interest rates based on a survey of mortgage lenders throughout the week. The Freddie Mac Primary Mortgage Survey reported that mortgage rates for the most popular loan products as of March 28, 2024, were as follows: The 30-year fixed mortgage rate was 6.79%, down from 6.87% last week. The 15-year fixed was 6.11%, down from 6.21% last week.
The graph below shows the trajectory of mortgage rates over the past year.
Home sales data is released on the third week of the month for the previous month by the National Association of Realtors and the California Association of Realtors. These are February’s home sales figures.
U.S. existing-home sales – The National Association of Realtors reported that existing-home sales totaled 4.38-million units on a seasonally adjusted annualized rate in February, down 3.3% from an annualized rate of 4.53 million in February 2023. The median price for a home in the U.S. in January was 384,100, up 5.7% from $363,600 last February. There was a 2.9-month supply of homes for sale in February, up from a 2.6-month supply one year ago. First-time buyers accounted for 32% of all sales. Investors and second-home purchases accounted for 21% of all sales. All-cash purchases accounted for 33% of all sales. Foreclosures and short sales accounted for 3% of all sales.
Year-over-year home prices jumped almost 10% in California – The California Association of Realtors reported that existing-home sales totaled 290,020 in February, up 12.8% from 257,040 closed sales in January and up 1.3% from a revised 286,290 homes sold on an annualized basis last January. There was a 3-month supply of homes on the market in February, down up from a 3.2-month month supply of homes in January and down from a 3.1-month supply one year ago. The statewide median price paid for a home in February was $809,460, up 9.7%from a revised median price of $789,480 last February.
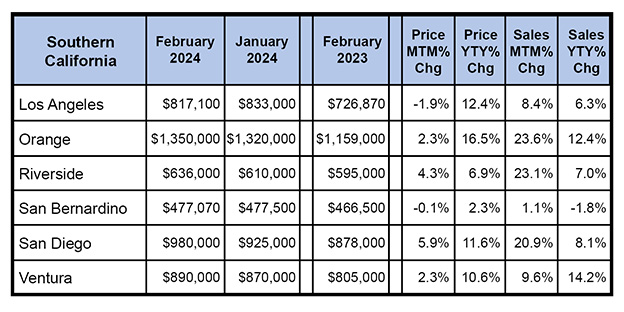
The graph below shows home sales figures by county in Southern California.