
It was a wild month for both stocks, bond yields and mortgage rates. The month started out with a jobs report showing that hiring was finally showing signs of slowing after picking back up since the start of the year. The CPI (consumer price index) came in at a year-over-year increase of 3.4% in April. That was down from 3.5% in March. Year-over-year the CPI was up 3.1% in January, 3.2% in February and 3.5% in March so an April reading of 3.4% was a welcome relief because it showed that inflation, which had picked up since the start of the year, may be moderating again. In the first two weeks of the month stock markets soared with the Dow closing over 40,000 for the first time in history and the NASDAQ hit an all-time high. Unfortunately, in the last two weeks several new indicators have suggested that inflation may still be not moving down as expected. The Fed released its “beige book” which gives their opinion on expectations. In that they stated that inflation was not coming down as steadily as they thought and that it may be a while until they begin cutting rates from 24-year high levels. One Fed governor even stated that there was a possibility of a rate hike. Stock markets dropped from their record highs earlier in the month and bond yields, and mortgage rates moved up on the last 10 days of the month. Fortunately, on Friday May 31, 2024, the Personal Consumption Index (PCE) was released. It showed that personal-consumption expenditures rose by 2.7% year-over-year in April. That was in line with expectations and indicated that inflation was slowing down and stock markets recovered from some of their steep losses in the final 10 days of the month and bond yields and mortgage rates dropped slightly. All eyes are on the job market. The May jobs report will be released next Friday. The hope is that hiring continued to slow in May from its torrid pace in March. New unemployment claims remain low and it is feared that the unemployment rate will remain below 4% for a 28th consecutive month setting a new record for the country. Such a low unemployment rate is considered a major contributor to inflation by the Federal Reserve, as people with jobs and no fear of losing their job spend more freely which causes price increases. Next Friday we will get the May jobs numbers. That will be an indicator of whether the economy is finally beginning to slow.
Stock Markets – The Dow Jones Industrial Average closed the month at 38,686.32, up 2.3% from 37,815.92 on April 30, 2023. It is up 2.4% year-to-date. The S&P 500 closed the month at 5,277.51, up 4.8% from 5,035.69 last month. It is up 10.7% year-to-date. The NASDAQ closed the month at 16,735.02, up 6.9% from 15,657.82 last month. It is up 11.4% year-to-date.
U.S. Treasury bond yields – The 10-year treasury bond closed the month yielding 4.51%, down from 4.69% last month. The 30-year treasury bond yield ended the month at 4.65%, down from 4.79% last month. We watch bond yields because mortgage rates often follow treasury bond yields.
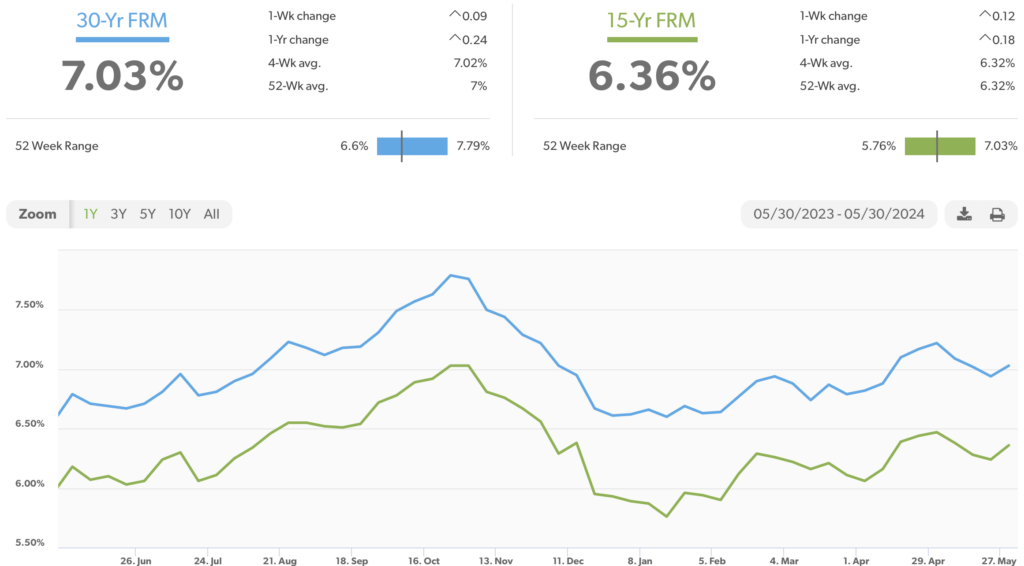
Mortgage rates – Every Thursday Freddie Mac publishes interest rates based on a survey of mortgage lenders throughout the week. The Freddie Mac Primary Mortgage Survey reported that mortgage rates for the most popular loan products as of April 25, 2024, were as follows: The 30-year fixed mortgage rate was 7.03%, down from 7.17% at the end of April. The 15-year fixed was 6.36%, down from 6.44% last month.
The graph below shows the trajectory of mortgage rates over the past year.
Freddie Mac was chartered by Congress in 1970 to keep money flowing to mortgage lenders in support of homeownership and rental housing. Their mandate is to provide liquidity, stability, and affordability to the U.S.
Home sales data is released on the third week of the month for the previous month by the National Association of Realtors and the California Association of Realtors. These are April’s home sales figures.
U.S. existing-home sales – The National Association of Realtors reported that existing-home sales totaled 4.14 million units on a seasonally adjusted annualized rate in April, down 1.95 from an annualized rate of 4.22 million in April 2023. The median price for a home in the U.S. in April was $407,600, up 5.7% from $385,800 last April. There was a 3.5-month supply of homes for sale in April, up from a 3-month supply one year ago. First-time buyers accounted for 33% of all sales. Investors and second-home purchases accounted for 16% of all sales. All-cash purchases accounted for 28% of all sales. Foreclosures and short sales accounted for 2% of all sales.
Year-over-year California home prices jumped 11.4% in April. – The California Association of Realtors reported that existing-home sales totaled 275,540 on a annualized rate in April, up 3% from an annualized rate of 267,470 in March, and up 4.4 from a revised 226,960 homes sold on an annualized basis last April. There was a 2.6-month supply of homes on the market in March, up from a 2.5-month supply one year ago. The statewide median price paid for a home in April was $904,210, up 5.8% from $854,490 in March and up 11.4% from a revised median price of $811,520 in April 2023.
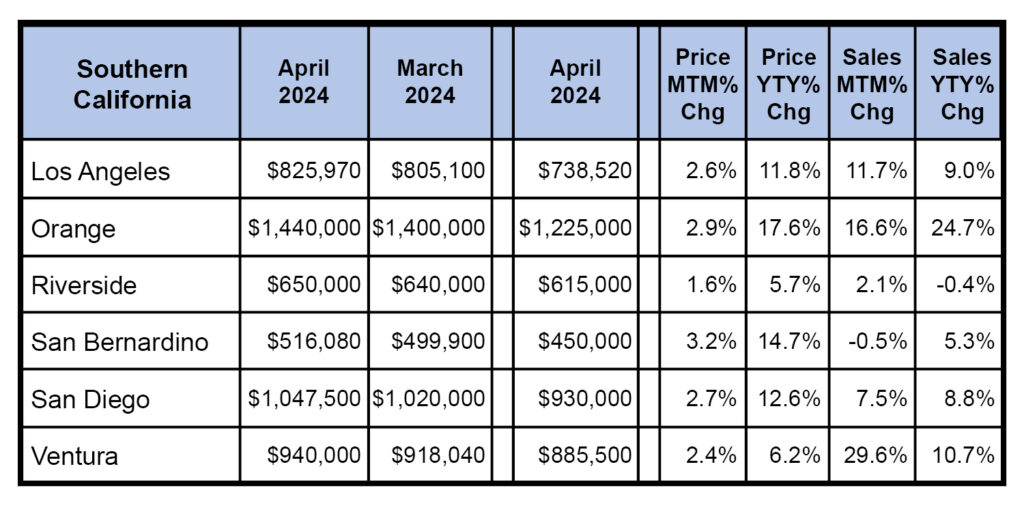
The graph below shows sales data by county in Southern California.
Have a great weekend!