| The September jobs report was released this week after being delayed by the shutdown – U.S. job growth picked up in September – The Bureau of Labor Statistics released its September jobs report, which was scheduled for release on October 3rd but was delayed by the government shutdown. They reported that 119,000 jobs were added in September, up from a revised loss of 4,000 jobs in August. This report points to a healthy pre-shutdown gain in employers’ confidence to increase hiring. The October jobs report will not be released. They will issue the unemployment rate with the November report in December. Part of the report is derived from surveys that were not done in October, which is the reason that a full report cannot be done for October. The unemployment rate increased to 4.4%, up from 4.3% in August, its highest level since 2021.
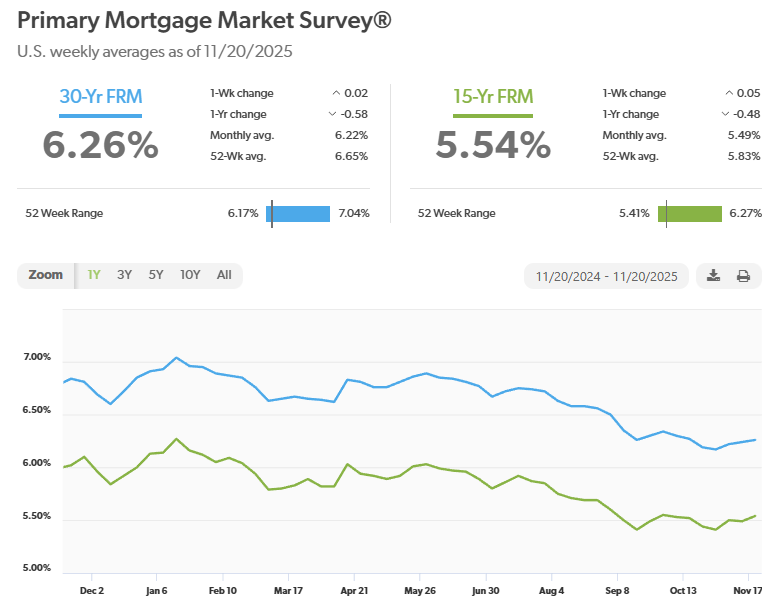
Stock Markets – The Dow Jones Industrial Average closed the week at 46,245.41, down 1.9% from 47,147.48 last week. Year-to-date, it is up 3.8% from 44,544.66 on December 31, 2024. The S&P 500 closed the week at 6,602.99, down 2% from 6,734.11 last week. Year-to-date, the S&P is up 9.3% from 6,040.53 on December 31, 2024. The Nasdaq closed the week at 22,273.08, down 2.7% from 22,900.59 last week. Year-to-date, it is up 13.5% from 19,627.44 on December 31, 2024. U.S. Treasury bond yields – The 10-year treasury bond closed the week yielding 4.06%, down from 4.14% last week. The 30-year treasury bond yield ended the week at 4.71% down slightly from 4.74% last week. We watch bond yields because mortgage rates follow bond yields. Mortgage rates – Every Thursday, Freddie Mac publishes interest rates based on a survey of mortgage lenders throughout the week. The Freddie Mac Primary Mortgage Survey reported that mortgage rates for the most popular loan products as of November 20, 2025, were as follows: The 30-year fixed mortgage rate was 6.26%, nearly unchanged from 6.24% last week. The 15-year fixed was 5.54%, up from 5.49% last week. The graph below shows the trajectory of mortgage rates over the past year.
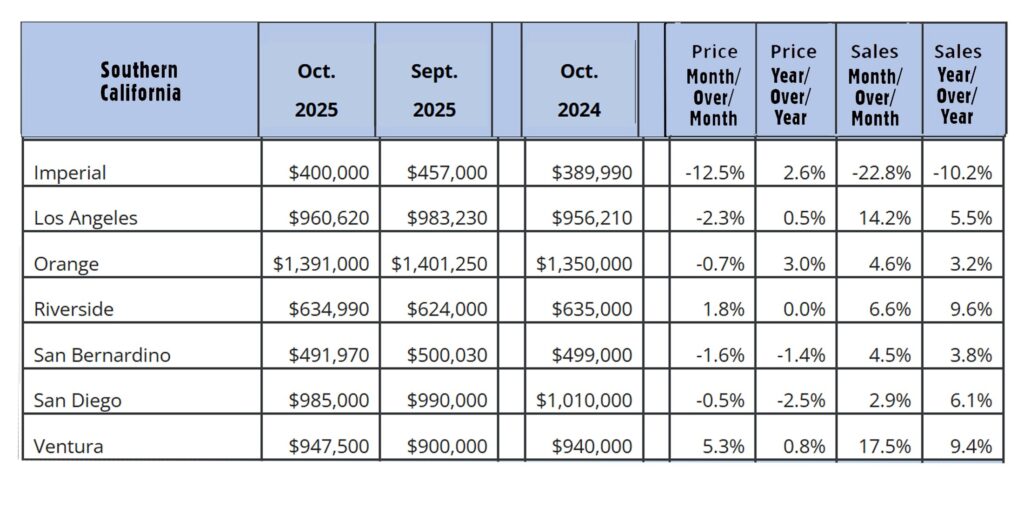
California existing-home sales – The California Association of Realtors reported that existing-home sales totaled 285,590 on an annualized basis in October, up1.9% from 277,410 in September. Year-over-year sales were up 4.1% from a revised 271,370 annualized home sales last October. The statewide median price paid for a home was $886,960 in October, down 0.2% from 888,740 in October 2024. The unsold inventory index showed that there was a 3.1-month supply of homes for sale in October. These numbers are a little deceiving. Prices have dropped more than the median price indicates. The median price is the mid-point of all homes sold. Basically, it’s the point where one half of the homes sold for more and one half of the homes sold for less. Usually, the median price is a good indicator of prices across the board. There are times when conditions impact that. This is one of those times. With stock market values at all-time highs, which they were in October, people who invested in the stock market are flusher than people that are not. Additionally, many of the factors that impact people’s ability and desire to buy a home affect people more in the lower income range than they affect people in higher income ranges. That’s happening now. Sales are down in all price ranges compared any time prior to interest rates rising in mid-2022, but sales in the lower price ranges as a percentage of all sales are fewer than we would normally see, as those people are more impacted by inflation, don’t have stocks, etc.
Have a Great Weekend! |
News & Media