Economic Update for the week ending January 8, 2022

Stock Markets – Stock markets rose to record levels on Monday despite a surge in COVID cases. The past seven days have been the highest weekly number of positive cases during the pandemic. New guidance from the CDC shortening quarantine times to five days from ten days was seen by investors as a shift in policy to keep people working due to labor shortages. This has investors feeling that further shutdowns were no longer going to be the policy. This was the best explanation for why stocks were rising while COVID surged. Unfortunately, on Wednesday minutes from the latest Federal Reserve meeting signaled that the Fed would make three rate hikes this year and dial back on bond purchases in order to combat inflationThis news caused interest rates to rise. Bond yields and mortgage rates rose fairly significantly, and stock markets dropped.  The Dow Jones Industrial Average closed the week at 36,231.66, down 0.3% from 36,338.30 last week. The S&P 500 closed the week at 4,677.03, down 1.9% from 4,766.18 last week. The NASDAQ closed the week at 14,935.90, down 4.6% from 15,644.97 last week.

U.S. Treasury bond yields – The 10-year treasury bond closed the week yielding 1.76%, up from 1.52% last week. The 30-year treasury bond yield ended the week at 2.11%, up from 1.90% last week. We watch bond yields because mortgage rates often follow treasury bond yields.

Mortgage rates – The January 6, 2022 Freddie Mac Primary Mortgage Survey reported mortgage rates for the most popular loan products as follows: The 30-year fixed mortgage rate was 3.22%, up from 3.11% last week. The 15-year fixed was 2.43%, up from 2.33% last week. The 5-year ARM was 2.41%, unchanged from 2.41% last week.

U.S. employers added 199,000 new jobs in December – The Department of Labor and Statistics reported that 199,000 new jobs were added in December. Economists surveyed had expected 422,000 new jobs. December marked a second straight month of job gains that were less than half of the number expected.  Despite slowing the past two months, 6.4 million new jobs were added in 2021 which was the most jobs added in a year ever. The unemployment rate was 3.9% in December, down from 4.2% in November. The labor-force participation rate (the share of workers with a job or actively looking for a job) stood at 61.9% in December. It remains below the 63.6% level before the pandemic. Average hourly wages rose 4.7% year-over-year.

Economic Update for week ending December 18, 2021

Stock markets were lower last week – Stock markets dropped on fears of higher interest rates following comments from the Federal Reserve. The Fed acknowledged that inflation had hit a 40-year high and that the accommodative loosening of the money supply was no longer needed. They stated that they were going to pull back on their bond-buying program that injects money into the economy and helps keep long term rates down. They also made comments that led investors to believe that there would be three rate hikes on their key overnight rates that currently stand near 0% to  keep the economy from remaining overheated. The Dow Jones Industrial Average closed the week at 35,365.44, down 0.6% from 35,970.99 last week. It is up 15.5% year-to-date. The S&P 500 closed the week at 4,620.64, down 2.0% from 4,712.02 last week. It is up 23.0% year-to-date. The NASDAQ closed the week at 15,169.96, down 3.0% from 15,630.60 last week. It is up 17.7% year-to-date.

U.S. Treasury bond yields – The 10-year treasury bond closed the week yielding 1.41%, down from 1.48% last week. The 30-year treasury bond yield ended the week at 1.82%, down from 1.86% last week. We watch bond yields because mortgage rates often follow treasury bond yields.

Mortgage rates – The December 16, 2021, Freddie Mac Primary Mortgage Survey reported mortgage rates for the most popular loan products as follows: The 30-year fixed mortgage rate was 3.12%, unchanged from 3.10% last week. The 15-year fixed was 2.34% up from 2.38% last week. The 5-year ARM was 2.45%, unchanged from 2.45% last week.

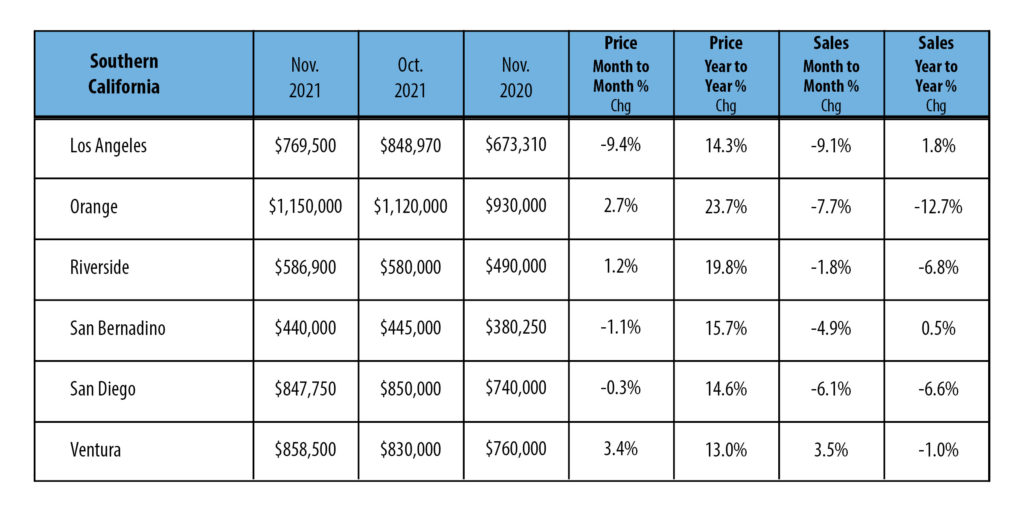
November California existing-home sales – The California Association of Realtors reported that existing-home sales totaled 454,450 on a seasonally adjusted annualized rate in November. That marked a month-over-month increase of 4.7% over the seasonally annualized rate of 434,170 in October. Year-to-date sales are up 10.6% from the same period last year. The median price paid for an existing home in November was $782,440, up 11.9% from last November when the median price was $698,980 There was a 1.6-month supply of homes for sale in November, down from a 1.9 month supply of homes for sale one year ago.

Below are regional figures.

Economic update for the week ending February 6, 2021


Stock markets ended the week at record highs – Major stock indexes followed their worst week since October with their best week since November. Markets erased all their losses from last week and stocks surged to record highs. Investors jumped back into the market based on many new developments. Those included: another round of stimulus, a drop in COVID cases, improved vaccination numbers, and more of the country lifting some of their business shut-down orders. The Dow Jones Industrial Average closed the week at 31,148.24, up 3.9% from 29,982.62 last week. It is up 1.8% year-to-date. The S&P 500 closed the week at 3,886.83, up 4.6% from 3,714.24 last week. It is up 3.5% year-to-date. The NASDAQ closed the week at 13,856.30, up a staggering 6.0% from 13,070.69 last week. It is up 7.5% year-to-date.

U.S. Treasury bond yields – The 10-year treasury bond closed the week yielding 1.19%, up from 1.11% last week. The 30-year treasury bond yield ended the week at 1.97%, up from 1.87% last week. We watch bond yields because mortgage rates often follow treasury bond yields.

Mortgage rates – The February 4, 2021, Freddie Mac Primary Mortgage Survey reported mortgage rates for the most popular loan products as follows: The 30-year fixed mortgage rate was 2.73%, unchanged from2.73% last week. The 15-year fixed was 2.21%, unchanged from 2.20% last week. The 5-year ARM was 2.78%, almost unchanged from 2.80% last week.

U.S. employers added 49,000 jobs in January – The Department of Labor and Statics reported that 49,000 net new jobs were added in January. While that was a disappointing number, it certainly is a turnaround from December when the economy lost 227,000 jobs. The unemployment rate dropped to 6.3% in January, from 6.7% in December. To date, the U.S. has 9.9 million fewer employees employed than in February 2020, before the pandemic, when the unemployment rate was at a 50-year low. Economists believe that the unemployment rate would be closer to 10% if not for so many disappointed workers leaving the job search. Fortunately, it is widely believed that jobs will begin to recover quickly as more people are vaccinated, COVID-19 cases continue to drop, and more of the economy reopens.

Home sales figures won’t be released for two more weeks. Our preliminary numbers point to the highest number of sales for any January since the California Association of Realtors began keeping records in the 1940s. We will have some preliminary figures next week with official figures the following week. Listings, sales, and prices are strong. Stay tuned!

Economic Update For The Month Ending January 31, 2021


Stock markets hit record highs before dropping at the end of January to end the month lower – Stock market indexes reached record-high levels in January, only to lose all of their gains in the last week of the month. Markets suffered their worst week since October as investors digested comments by the Fed, a disappointing fourth-quarter GDP report, increasing job losses, and a pullback in consumer spending. The Fed shocked investors early in the week when they made comments suggesting that their key overnight rates would remain at or near zero percent for an extended period which could last years after the pandemic is over. This suggested that the Fed has data that the impact of the pandemic on the economy would last longer than investors believed. On Friday a preliminary GDP report revealed that the economy contracted for the first time since the financial crisis, and suffered its largest yearly contraction since 1946. Retail and service sales reports showed that consumers had pulled back on purchases for goods and services in the fourth quarter, reversing a historic 33% quarter-over-quarter increase in the third quarter. Business investment, and residential real estate were sectors that surged in 2020, according to the GDP report. Job losses also increased in December and January as much of the country instituted more restrictions on business, including some states re-issuing stay-at-home orders. Fortunately, it’s widely believed that the $900 billion in stimulus from the CARES Act 2 that will be distributed in the first quarter of 2021 will increase consumer spending and grow the economy. Investors remain optimistic and expect the effects of the stimulus, the drop in COVID cases nationwide which has led to a loosening of restrictions and reopenings, increased vaccine disbursement, and future stimulus to continue to revive the economy, and boost hiring. The Dow Jones Industrial Average ended the month at 29,982.62, down 2.0% from 30,606.48 on December 31. The S&P 500 closed the month at 3,714.24, down 1.1% from 3,230.78 at the end of December. The NASDAQ closed the month at 13,079.69, up 1.4% from 12,888.28 on December 31, 2020.

U.S. Treasury Bond Yields dropped sharply in 2020 – The 10-year U.S. treasury bond yield closed the year at 1.11%, up from 0.93% On December 31, 2019. The 30-year treasury yield ended the year at 1.87%, up from 1.65% on Dec. 31, 2019. We watch bond yields because mortgage rates follow treasury bonds.

The U.S. Economy lost 140,000 jobs in December – Jobs data is reported on the first Friday of every month. This is the data for December. The Department of Labor Statistics reported that 140,000 non-farm jobs were lost in December. This marked the first month of net job losses since April. As COVID-19 cases continue to spike, most states and local governments have entered more restrictive shutdowns. This has caused another round of layoffs. The unemployment rate in December was 6.7%.

Mortgage Rates – The January 28, 2021, Freddie Mac Primary Mortgage Survey reported that the 30 year fixed rate mortgage average was 2.73%, up from 2.67% on December 28, 2020. The 15-year fixed was 2.20%, up from 2.17% last month. The 5-year ARM was 2.80%, up from 2.71% at the end of December.

Home sales data is reported on the third week of each month for the previous month. These are December’s results.

2020 marked the highest number of U.S. existing-home sales since 2006 – The National Association of Realtors reported that the number of homes sold in December was 22.2% above the number of homes sold last December. Despite the pandemic, 2020 marked the highest number of homes sold since 2006. The median price paid for a home in December was $309,800, up 12.9% from $274,500 in December 2019. With new listings surging, but not able to keep pace with buyer demand, inventory shrunk to record low housing supplies in 2020. There was just a 1.9 month supply of homes for sale in December, down from a 3.0 month supply one year ago.

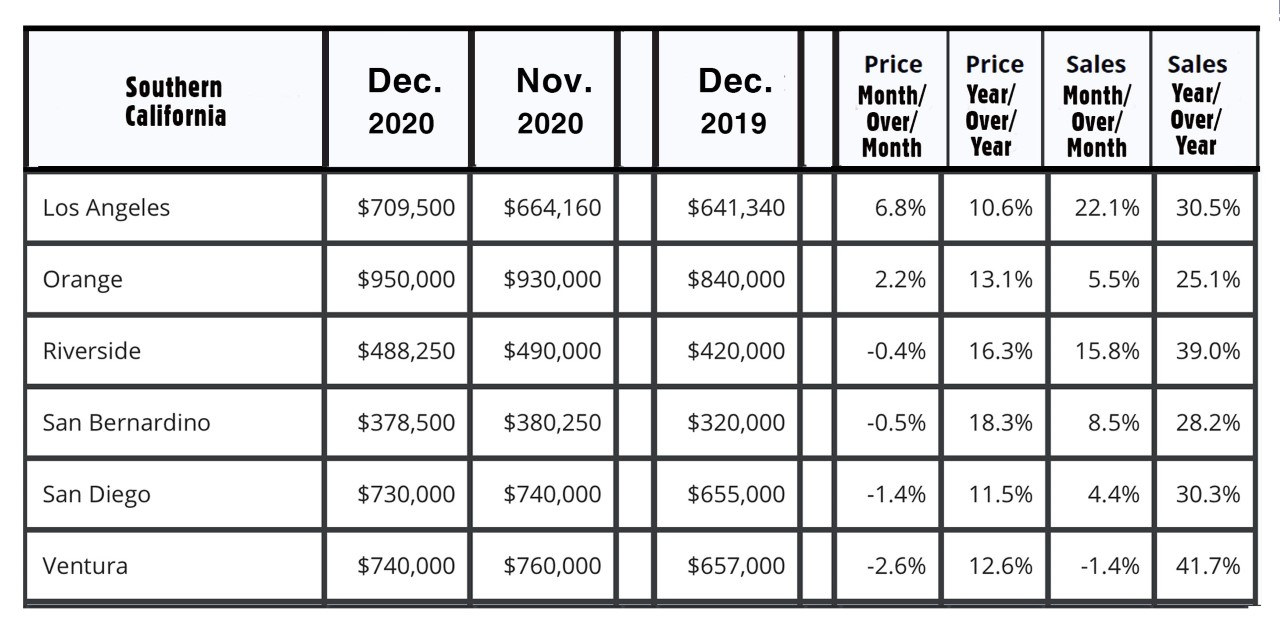
California existing home sales – The California Association of Realtors reported that existing, single-family home sales totaled 509,750 on an annualized basis in December. That represented a year-over-year increase of 28% from the 398,370 annualized rate of homes sold in December 2019. It was the highest number of monthly home sales in 15 years, and the most homes ever sold in December. Home sales are homes that closed escrow. Pending home sales are new contracts signed. Those are at near-record levels as well. For the entire year, 411,870 homes sold, up 3.5% from 397,960 homes sold in 2019. That number is pretty incredible considering home sales were down almost 30% at the end of June. There was a record number of sales in the second half of the year. The median price paid for a home in California was $717,930, up 16.8% from the median price of $659,380 last December. Inventory levels were lower than one year ago. There was just a 1.3-month supply of homes for sale in December, down from a 2.5-month supply one year ago. The current supply of homes was almost unchanged from September and October, as a record number of new listings were taken in November but sold quickly. Below please find a graph of regional statistics for Southern California.

Economic Update for the week ending October 24, 2020


Stock markets moderately lower this week – Stocks markets closed slightly lower this week following three weeks of health gains. Third-quarter corporate profits began to be reported. They were stronger than expected. Investors watched for another round of stimulus to be agreed upon, but despite several deadlines, nothing was accomplished. The good news is that investors are convinced one will be passed, but it could be after the election when it will be safer for congresspeople to compromise without the fear of losing votes. The Dow Jones Industrial Average closed the week at 28,335.67, down 0.9% from 28,608.31 last week. It’s down 0.7% year-to-date. The S&P 500 closed the week at 3,465.39, down 0.5% from 3,483.81 last week. It’s up 7.3% year-to-date. The NASDAQ closed the week at 11,548.58, down 1.1% from 11,671.56 last week. It’s up 28.7% year-to-date.

U.S. Treasury bond yields – The 10-year treasury bond closed the week yielding 0.85%, up from 0.76% last week. The 30-year treasury bond yield ended the week at 1.64% up from 1.52% last week. We watch bond yields because mortgage rates often follow treasury bond yields.

Mortgage rates – The October 22, 2020, Freddie Mac Primary Mortgage Survey reported mortgage rates for the most popular loan products as follows: The 30-year fixed mortgage rate average was 2.80%, unchanged from 2.81% last week. The 15-year fixed was 2.33%, almost unchanged from 2.35% last week. The 5-year ARM was 2.87%, almost unchanged from 2.90% last week.

The California Association of Realtors reported that existing, single-family home sales totaled 489,590 on an annualized basis in September. That represented a month over month increase of 5.2.% from August and a staggering year over year increase of 21.2% from the number of homes sold in September 2019. Usually, because of seasonal adjustments, home sales begin to cool in September, but this September marked the highest monthly number of homes sold in over a decade. The median price paid for a home in California was $712,430, up 17.6% from the median price last September. Inventory levels were lower than one year ago. There was just a two month supply of homes for sale in September. On a regional level, the median price paid for a home was sharply higher than one year ago. The year-over-year increases were as follows: LA County’s median price was $747,380, up 12.7% from last September. Ventura County’s median price was $787,500, up 19.5% from last September. Orange County’s median price was $915,000, up 10.2% from last September.

The National Association of Realtors will be releasing data next week. The U.S. numbers will be included in next week’s report.

Economic update for the week ending October 10, 2020

Stock markets had their best week in three months – It was a strange week on Wall Street. Stocks opened the week higher as Treasury Secretary  Mnuchin has begun to bridge the gap between democrats and republicans on another round of stimulus. Stocks dropped midweek after President Trump announced that there would not be a stimulus bill passed until after the election. The following day he announced that a deal was close, and the White House increased their stimulus package from $1.6 trillion to $1.8 trillion. The House had approved a package for $2.2 trillion. Investors feel that a deal is close and stocks rallied on the prospect of approximately $2 trillion added to the economy. The Dow Jones Industrial Average closed the week at 28,586.90, up 3.3% from 27,681.71 last week. It’s down 0.2% year-to-date. The S&P 500 closed the week at 3,477.13, up 3.8% from 3,384.44 last week. It’s up 7.6% year-to-date. The NASDAQ closed the week at 11,579.94, up 4.6% from 11,075.02 last week. It’s up 29.1% year-to-date.

U.S. Treasury bond yields – The 10-year treasury bond closed the week yielding 0.79%, up from 0.70% last week. The 30-year treasury bond yield ended the week at 1.58%, up from 1.48% last week.

Mortgage rates – The October 8,  2020, Freddie Mac Primary Mortgage Survey reported mortgage rates for the most popular loan products as follows: The 30-year fixed mortgage rate average was 2.87%, unchanged from 2.88% last week. The 15-year fixed was 2.37%, unchanged from 2.36% last week. The 5-year ARM was 2.89%, unchanged from 2.90% last week.

September home sales figures should be released either at the end of next week or the beginning of the following week. Those results will appear in upcoming updates.

Economic update for the week ending October 3, 2020


The Dow Jones Industrial Average closed the week at 27,682.71, up 1.9% from 27,173.96 last week. It’s down 3.0% year-to-date. The S&P 500 closed the week at 3,348.44, up 1.5% from 3,298.96 last week. It’s up 3.6% year-to-date. The NASDAQ closed the week at 11,075.02, up 1.5% from 10,913.56 last week. It’s up 23.4% year-to-date.

U.S. Treasury bond yields – The 10-year treasury bond closed the week yielding 0.70%, up slightly from 0.66% last week. The 30-year treasury bond yield ended the week at 1.48%, up from 1.40% last week.

Mortgage rates – The October 1, 2020 Freddie Mac Primary Mortgage Survey reported mortgage rates for the most popular loan products as follows: The 30-year fixed mortgage rate average was 2.88%, down slightly from 2.90% last week. The 15-year fixed was 2.36%, down from 2.40% last week. The 5-year ARM was 2.90%, unchanged from 2.90% last week.

The U.S. economy added 661,000 jobs in September – The Department of Labor Statistics reported that employers added 661,000 jobs in September. Analysts expected 800,000 new jobs, so this number was quite a bit below expectations. This represented a slowing in the pace of the jobs recovery, as over 1.3 million jobs were added in August. Th e unemployment rate dropped to 7.9% in September. It was 8.4% in August.

Economic update for the week ending September 26, 2020 

Stocks were down for a seventh straight week – The Dow and S&P closed  lower again this week. Major contributors to the drop in stocks this week were: New Coronavirus cases increased both in the U.S. and Europe. Hopes of a new round of stimulus once thought to be done deal has faded. It is feared that no stimulus package will be approved before the election. Trade tensions with China appear to be escalating. First time unemployment claims increased unexpectedly last week.
The Dow Jones Industrial Average closed the week at 27,173.96, down 1.7% from 27,657.42 last week. It’s down 4.8% year-to-date. The S&P 500 closed the week at 3,298.96, down 0.6% from 3,319.47 last week. It’s up 2.1% year-to-date. The NASDAQ closed the week at 10,913.56, up 1.1% from 10,893.28 last week. It’s up 21.6% year-to-date.

U.S. Treasury bond yields – The 10-year treasury bond closed the week yielding 0.66%, down slightly from 0.70% last week. The 30-year treasury bond yield ended the week at 1.40% down from 1.45% last week.

Mortgage rates – The September 24, 2020, Freddie Mac Primary Mortgage Survey reported mortgage rates for the most popular loan products as follows: The 30-year fixed mortgage rate average was 2.90%, unchanged from 2.87% last week. The 15-year fixed was 2.40%, unchanged from 2.37% last week. The 5-year ARM was 2.90%, down from 2.96% last week.

U.S. existing-home sales and prices soared in August –  The National Association of Realtors reported that U.S. existing-home sales hit  6 million in August on a seasonally adjusted yearly basis. The number of homes sold in August was 10.5% higher than August 2019. That marked the highest number of homes sold in a month since December 2006. Prices also surged. Nationally the median price paid for a home jumped 11.4% from one year ago. 

Economic update for the week ending August 29, 2020

Stocks up for a fifth straight week – Stock markets rallied on vaccine trial results, and testimony by Federal Reserve Chairman Jerome Powell. Chairman Powell committed to leave the Fed’s interest rates near zero percent even if inflation began to exceed the target 2% annual rate. The S&P 500, and the NASDAQ closed at record highs again this week. The DOW is also rapidly approaching its record high set in February. The Dow Jones Industrial Average closed the week at 28,653.87, up 2.6% from 27,930.33 last week. It’s down 0.4% year-to-date. The S&P 500 closed the week at 3,508.01, up 3.3% from 3,397.16 last week. It’s up 8.6% year-to-date. The NASDAQ closed the week at 11,695.63, up 3.4% from 11,311.81 last week. It’s up 30.3%  year-to-date.

U.S. Treasury bond yields – The 10-year treasury bond closed the week yielding 0.74%, up from 0.64% last week. The 30-year treasury bond yield ended the week at 1.52%, up from 1.35% last week.

Mortgage rates – The August 27, 2020 Freddie Mac Primary Mortgage Survey reported mortgage rates for the most popular loan products as follows: The 30-year fixed mortgage rate average was 2.91%, down from 2.99% last week. The 15-year fixed was 2.46%, down from 2.54% last week. The 5-year ARM was 2.91%, unchanged  from 2.91% last week.

Additional refinance fee postponed until December 1, 2020 – Two weeks ago the Federal Housing Finance Agency announced that they were enacting an additional fee of 1/2% on all refinance loans funded on or after September 1, 2020. That additional fee would be charged on all government sponsored loans which include, Fannie Mae, Freddie Mac, FHA and VA loans. The reason for this fee was to offset loses caused by the coronavirus crisis, which include forbearance, and delayed foreclosures. The Mortgage Bankers Association, and the National Association of Realtors are among the many groups fighting against the implementation of this fee.

Month End Economic Update for April 2020

Stock Market Update

The Dow Jones Industrial Average ended the month of April at 24,345.72, up 11% from 21,917.16 on March 30, 2020. The S&P 500 closed the month at 2,912.44, up 12.6% from 2,585.59 at the end of March. The NASDAQ closed the month at 8,889.55, up 15.5% from 7,700.10 on March 30, 2020.

U.S. Treasury Bond Yields dropped to record lows in April

The 10-year U.S. treasury bond yield closed the month of April at 0.64%, down from 0.70% on March 30. The 30-year Treasury yield ended the month at 1.28%, down from 1.35% at the end of March.

Mortgage Rates dropped to record lows in April

The April 30, 2020 Freddie Mac Primary Mortgage Survey reported that the 30-year fixed mortgage rate average was 3.23%, down from 3.33% on April 2, 2020. The 15-year fixed was 2.77%, down from 2.82% April 2. The 5-year ARM was 3.14%, down from 3.49% on April 2, 2020.


Home sales reports are released on the third week of the month for the previous month. These are the March results.

March 2020 U.S. Home sales report

The National Association of Realtors reported the total existing-home sales in March fell just 0.8% from the number of sales in March 2019. Considering that 80% of the country was under a stay-at-home order in March, this was quite a positive result. These homes went under contract before the crisis, as most closings take 30-60 days, but the buyers did close during the crisis. Prices were also up significantly in March. The median price was 8.0% higher than last March. That marked the 97th straight month of year over year increases in the median price. Inventory levels were tight. There was a 3.4 month supply of housing on the market.

California March Home Sales Report

Impact of the pandemic has begun to be felt as the number of sales dropped while prices continued to rise – The California Association of Realtors announced that existing single-family home sales totaled 373,070 on a seasonally adjusted annualized rate in March, down 6.1% from the number of sales in March 2019. The statewide median price paid for a home in March was $612,440, up 5.6% from February and up 8.3% from one year ago. The median price is the point at which 1/2 the homes sell for more 1/2 the homes sell for less. Escrows periods are commonly between 30 and 60 days, so these sales represent homes placed in escrow before the crises. Homes sold during the crises are just beginning to close. There was a record low 2.7 month supply of homes for sale in March compared to a 3.6 month supply in February and a 3.6 month supply of homes for sale last March. That is due to so many people removing their homes from the market. On a regional level: In Los Angeles County the median price increases 8.1% from last March. In Orange Country the median price increased 9% from one year ago. In Ventura County the median price increased 10.2% from last March.