Stock markets continued to fall in February – High inflation, a heated economy, and strong employment figures led investors to fear that the Fed would raise interest rates faster and higher than previously felt. Those fears drove interest rates higher on bonds and mortgages and led investors to sell stocks in fear that higher borrowing costs would lead to reduced profits. Later in the month, Russia invaded Ukraine. Sanctions placed on Russia also impacted stock markets around the world and energy prices surged. This actually caused mortgage rates and bond yields to fall in the last days of the month, as any headwind in the economy may slow the Fed’s desire to raise interest rates. The Dow Jones Industrial Average closed the month at 33,892.60, down 3.3% from 35,131.86 on January 31. It is down 6.8% year-to-date. The S&P 500 closed the month at 4,373.94, down 3.8% from 4,515.55 last month. It is down 8.2% year-to-date. The Nasdaq closed the month at 13,751.40, down 4.4% from 14,239.98 last month. It is down 12.1% year-to-date.
U.S. Treasury bond yields – The 10-year treasury bond closed the month yielding 1.83%, up from 1.76% last month. The 30-year treasury bond yield ended the month at 2.17%, up from 2.11% last month. We watch bond yields because mortgage rates often follow treasury bond yields.
Mortgage rates – The February 24, 2021 Freddie Mac Primary Mortgage Surveyreported that mortgage rates for the most popular loan products were as follows: The 30-year fixed mortgage rate was 3.89%, up from 3.55% last month. The 15-year fixed was 3.14%, up from 2.80% last month. The 5-year ARM was 2.98%, up from 2.70% last month.
The February jobs report will be released on Friday. Monthly home sales and pricing figures are released by the California Association of Realtors and the National Association of Realtors on the third week of the month for the previous month. These are January’s results.
U.S. employers added 467,000 new jobs in January – The Department of Labor and Statistics reported that 467,000 new jobs were added in January. Economists surveyed had expected a very small increase and possibly a decrease in jobs due to the COVID surge, so this was considered a substantial spike in new jobs. The November and December new jobs numbers were also revised higher. The Labor Department has now revised the job growth in 2021 to 6.7 million new jobs added, an all-time record. The unemployment rate increased slightly to 4% in January, up from 3.9% in December, as more workers entered the workforce. The labor-force participation rate (the share of workers with a job or actively looking for a job) rose to 62.2% in January from 61.9% in December. It remains below the 63.6% level before the pandemic but finally seems to be moving up. Average hourly wages increased to $31.63 per hour, a year-over-year increase of 5.7%.
January 2022 U.S. Existing Home Sales – The National Association of Realtorsreported that existing-home sales totaled 6.5 million on a seasonally adjusted annualized rate in January, up 6.7% month-over-month from the annualized rate of sales in December 2021. Year-over-year sales were down 2.3% from the annualized rate of 6.65 million in January 2021. The median price of a home in the U.S. in January was $350,300, up 15.4% from $303,600 one year ago. January marked a record 119-straight months of year-over-year increases in the median price. Inventory levels remained at record lows. There was just a 1.6 month supply of homes for sale in January, down from a 1.9 month supply in January 2021. First-time buyers accounted for 27% of all sales, down from 33% one year ago. Investors and second-home purchases accounted for 22% of all sales, up from 17% last January. All-cash purchases accounted for 27% of all sales, up from 19% in January 2021. Foreclosure and short-sales accounted for less than 1% of all sales remaining at a historic low.
California housing affordability improved in the fourth quarter of 2021 – The California Association of Realtors published their third-quarter housing affordability report this week. They found that 25% of California households could afford to purchase a $797,470 median-priced home. That is up from 24% in the third quarter of 2021, but down from 27% in the fourth quarter of 2020. A minimum income of $148,000 was needed to qualify for the monthly payment of $3,700 which included principal, interest, and taxes on a 30-year fixed-rate mortgage at a 3.28% rate. Condominiums were more affordable. The report found that 36% of California households were able to afford a $610,350 median-priced condo or townhouse. A minimum annual income of $113,200 was needed to qualify for the monthly payment of $2,830.
January California existing-home sales – The California Association of Realtorsreported that existing-home sales totaled 444,540 on a seasonally adjusted annualized rate in January. That marked a 3.4% month-over-month increase from the number of homes that closed escrow in December 2021. The median price paid for an existing home in January was $765,580, up 9.4% from last January when the median price was $699,920. There was a 1.8-month supply of homes for sale in January, up from 1.4 months in January 2021.
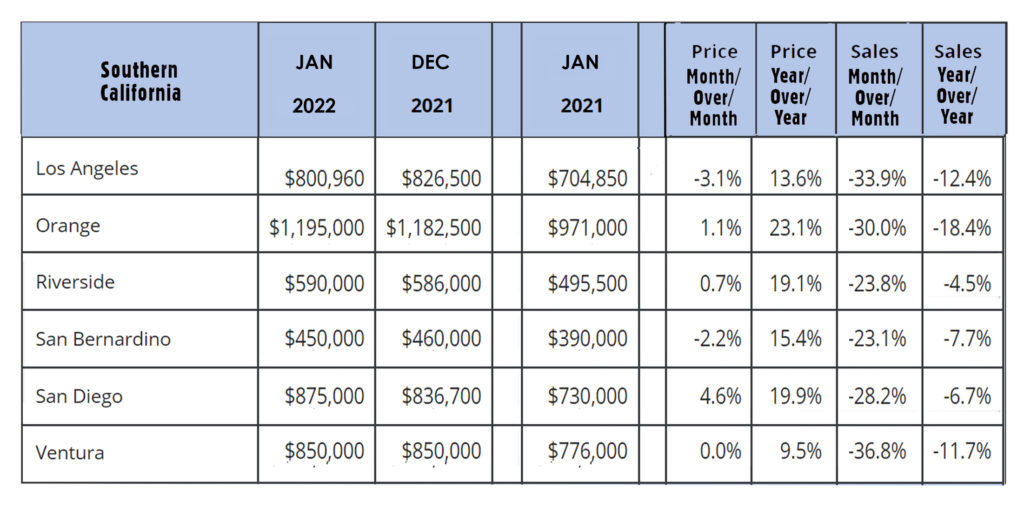
Although California as a whole had a month-over-month increase in sales, Southern California saw a dramatic drop in sales. The chart below shows regional figures.