Stock markets suffered steep losses in April – U.S. stocks closed out a brutal month with almost unprecedented losses. The Nasdaq had its worst month since 2008 as the technology stock sell-off continued. The Nasdaq is now in bear territory, down more than 20% for the year. The S&P had its worst month since March 2020 when the pandemic shutdown was enacted. For the first four months of 2022, the S&P has dropped 13.3%, its largest first four-month decline since World War II. Higher interest rates, inflation, higher fuel costs, supply shortages, the war in Ukraine, and higher employment costs have investors feeling that earnings, while strong in the first quarter, will be lower in the future. The Dow Jones Industrial Average closed the week at 32,977.21, down 4.1% from 34,678.35 on March 31. It’s down 9.25% year-to-date. The S&P 500 closed the week at 4,131.93, down 8.8% from 4,530.31 last month. The S&P is down 13.3% year-to-date. The NASDAQ closed the week at 12,334.64, down 13.3% from 14,220.52 last month. It is down 21.2%, year-to-date.
U.S. Treasury bond yields – The 10-year treasury bond closed the week yielding 2.89%, up from 2.32% last month. The 30-year treasury bond yield ended the week at 2.96%, up from 2.44% last month. We watch bond yields because mortgage rates often follow treasury bond yields.
Mortgage rates – Home mortgage rates have continued to increase. Freddie Mac Primary Mortgage Survey reported that mortgage rates as of April 28, 2022 for the most popular loan products were as follows: The 30-year fixed mortgage rate was 5.10%, up from 4.67% last month. The 15-year fixed was 4.40% up from 3.83% last month. The 5-year ARM was 3.50%, up from 3.75% last month.
The U.S. economy added 431,000 new jobs in March – The Department of Labor and Statistics reported that 431,000 new jobs were added in March. Economists surveyed had expected 490,000 new jobs. The unemployment rate fell to 3.6% in March, down from 3.8% in February. The labor-force participation rate (the share of workers with a job or actively looking for a job) rose to 62.4% in March, up from 62.3% in February. It is still below the 63.6% level before the pandemic but has moved up steadily as more people are returning to the workforce. Average hourly wages, an indicator of inflation increased 5.6% from March 2021. The April jobs report will be released next Friday.
March 2022 home sales – Home sales figures are released in the third week of the month for the previous month.
U.S. existing-home sales – The National Association of Realtors reported that existing-home sales totaled 5.77 million on a seasonally adjusted annualized rate in March, down 2.7% month-over-month from the annualized rate of sales in February. Year-over-year sales were down 4.5% from the annualized rate of 6.04 million in March 2021. The median price of a home in the U.S. in March was $375,300, up 15.0% from $326,300 one year ago. March marked a record 121 consecutive months of year-over-year increases in the median price. Inventory levels remained near record lows. There was just a 2-month supply of homes for sale in March, down from a 2.1 month supply one year ago. First-time buyers accounted for 30% of all sales. Investors and second-home purchases accounted for 18% of all sales. All-cash purchases accounted for 28% of all sales. Foreclosure and short-sales accounted for less than 1% of all sales remaining at a historic low.
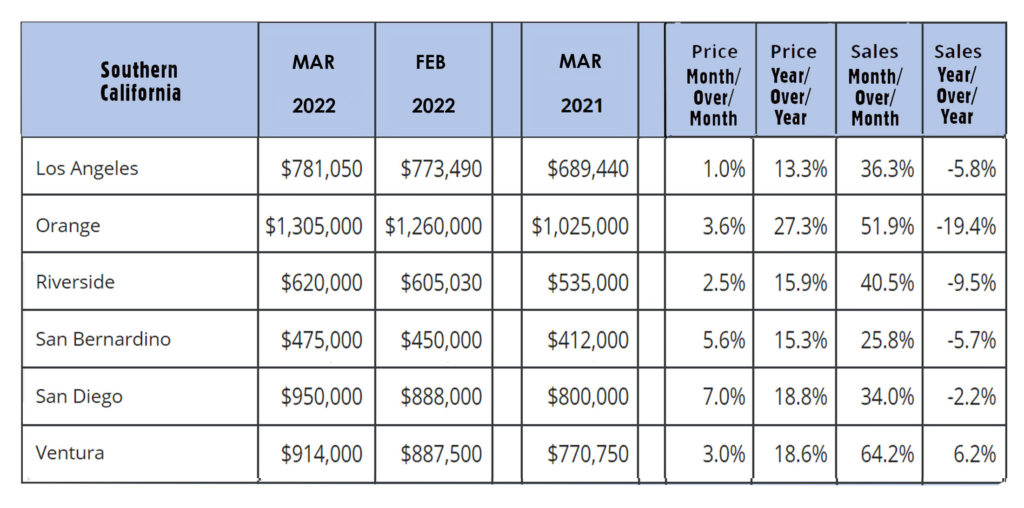
California existing-home sales – The California Association of Realtors reported that existing-home sales totaled 426,970 on a seasonally adjusted annualized rate in March. That marked a 4.4% year-over-year drop from the number of homes sold in March 2021. Existing-home sales in the first quarter of 2022 are down 7.0% from the number of homes sold in the first quarter of 2021, which pretty closely matches the drop in the number of new listings. The median price paid for a home in March was $849,080, up 10.1% from February’s median price of $771,270. Year-over-year prices are up 11.9%. There was a 1.7-month supply of homes for sale in March, down from a 2-month supply of homes for sale in February, and unchanged from a 1.7-month supply of homes in March 2021.
The graph below shows regional figures by county in Southern California.