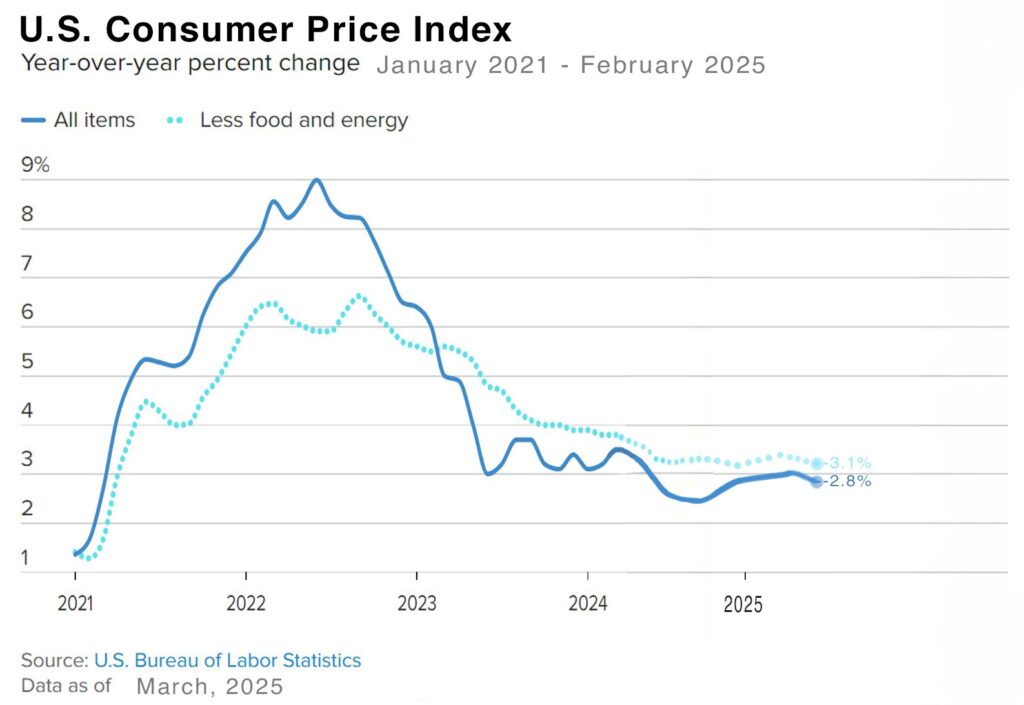
| This week the Federal Reserve met to discuss monetary policy. On Wednesday they issued their monetary policy statement. While they left interest rates unchanged, they said that they are going to pause reducing their balance sheet in April. That means that the Fed will halt its sales of the treasury bond securities that they own. One of the ways that they brought long-term rates down during COVID and the financial crisis was to purchase treasury bonds and mortgage securities. Over the past three years, they have been selling those assets to reduce their balance sheet. By halting those sales there will be fewer treasury bonds on the market which should drive yields and long-term interest rates lower. Bond yields and mortgage rates have dropped since the Fed made the announcement on Wednesday.
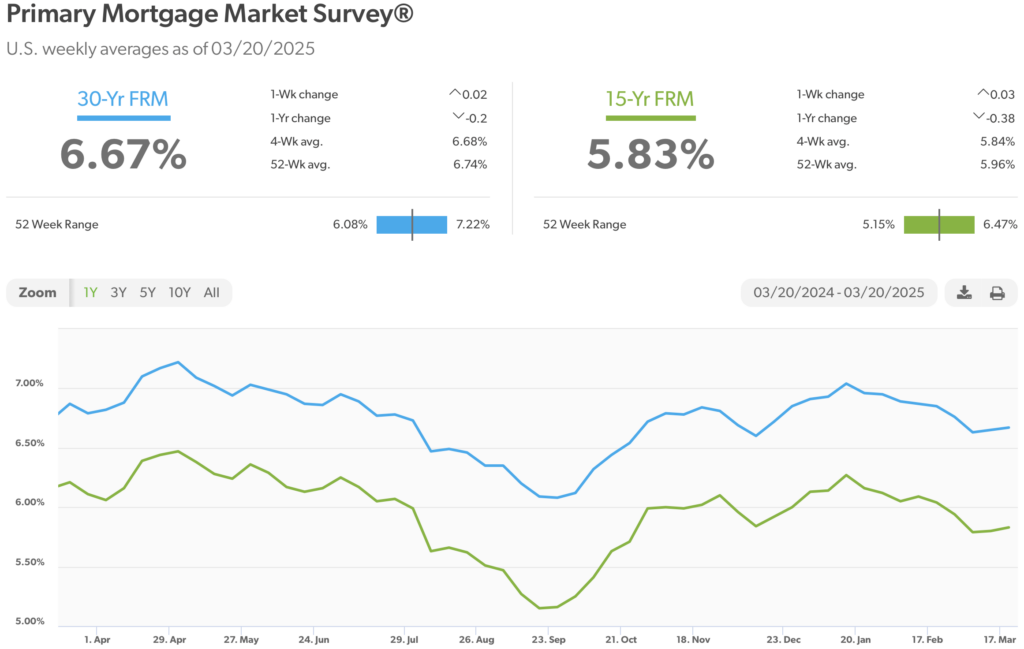
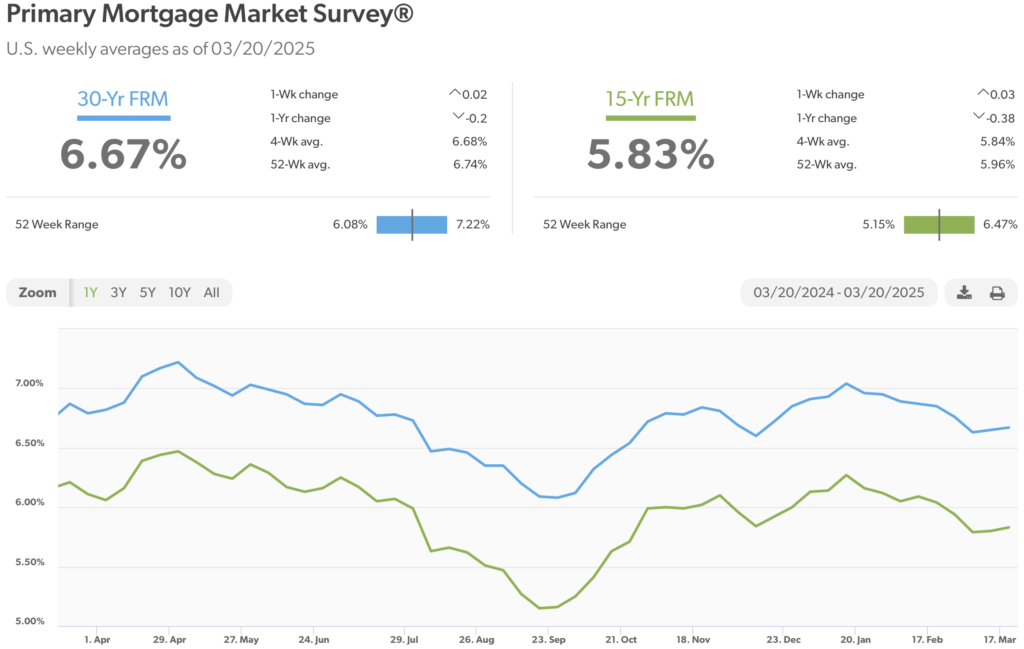
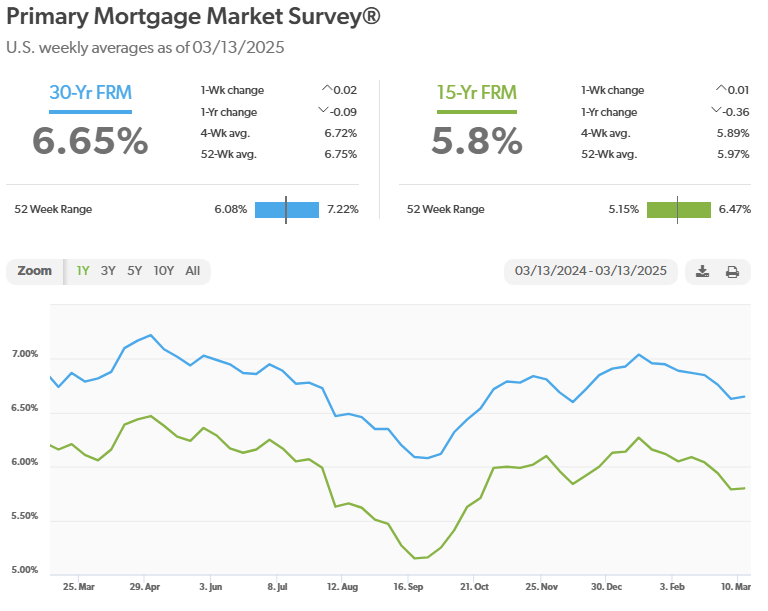
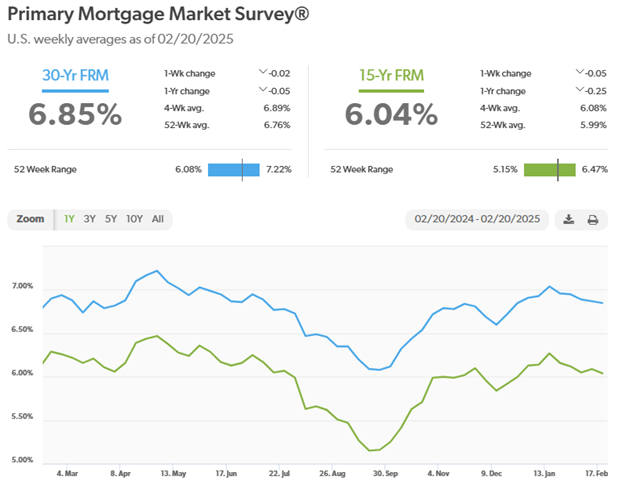
Stock markets -The Dow Jones Industrial Average closed the week at 41,985.35, up 1.2% from 41,488.19 last week. It is down 1.3% year-to-date. The S&P 500 closed the week at 5,667.56, up 0.5% from 5,638.94 last week. The S&P is down 3.6% year-to-date. The Nasdaq closed the week at 17,784.05, up 0.2% from 17,754.09 last week. It is down 7.9% year-to-date. U.S. Treasury bond yields The 10-year treasury bond closed the week yielding 4.25%, down from 4.31% last week. The 30-year treasury bond yield ended the week at 4.59%, down from 4.62% last week. We watch bond yields because mortgage rates follow bond yields. Mortgage rates – Every Thursday Freddie Mac publishes interest rates based on a survey of mortgage lenders throughout the week. The Freddie Mac Primary Mortgage Survey reported that mortgage rates for the most popular loan products as of March 20, 2025, were as follows: The 30-year fixed mortgage rate was 6.67%, up slightly from 6.65% last week. The 15-year fixed was 5.83%, up slightly from 5.80% last week. Rates ended the week lower after the Fed announced that they were going to pause reducing their balance sheet on Wednesday. The graph below shows the trajectory of mortgage rates over the past year.
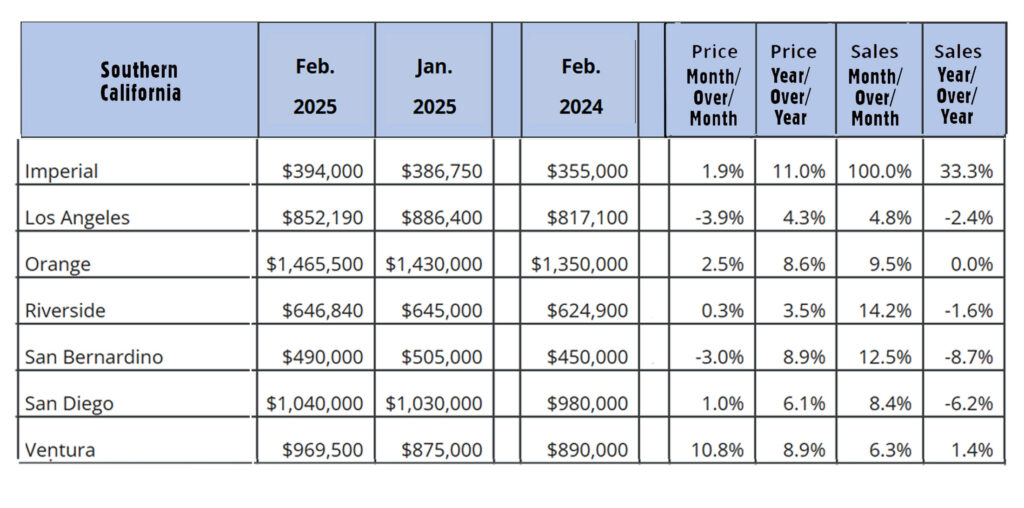
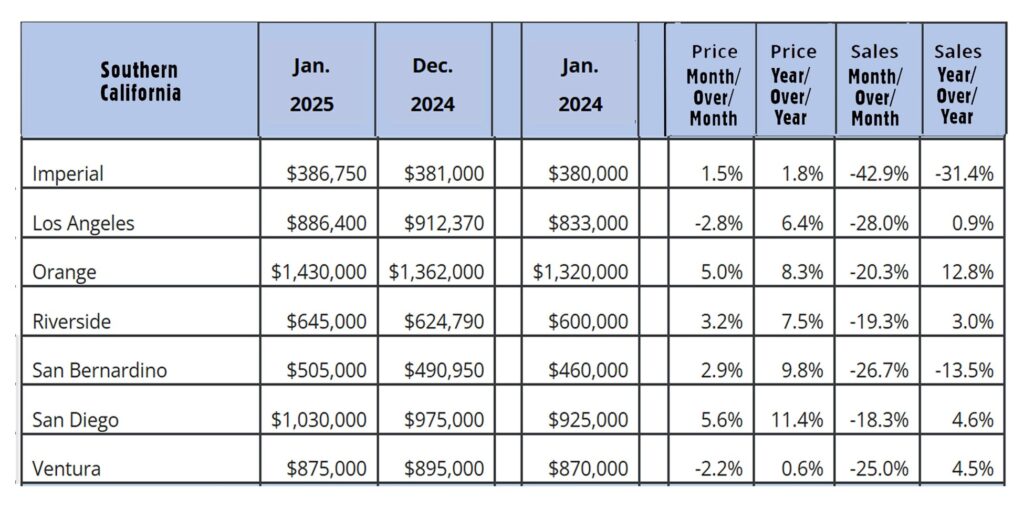
Home sales data is released on the third week of the month for the previous month by the California Association of Realtors and the National Association of Realtors. These are February’s home sales figures. U.S. existing-home sales February 2025 – The National Association of Realtors reported that existing-home sales totaled 4.26-million units on a seasonal annualized rate in February, up 1.2% from an annualized rate of 4-million units last February. The median price for a home sold in the U.S. in February was $398,400 up 3.8% from $383,800 one year ago. There was a 3.5-month supply of homes for sale in February, up from a 3-month supply one year ago. First-time buyers accounted for 31% of all sales. Investors and second-home purchases accounted for 16% of all sales. All cash purchases accounted for 32% of all sales. Foreclosures and short sales accounted for 3% of all sales. California existing-home sales – The California Association of Realtors reported that existing-home sales totaled 283,540 on an annualized basis in February, up 11.6% month-over-month from 254,110 homes sold on an annualized basis in January, and up 2.6% year-over-year from a revised 278,280 homes sold on an annualized basis. The statewide median price paid for a home in was $829,060 in February, up 2.8% from $806,480 one year ago. There was a 4-month supply of homes for sale in January, up from a 2.9-month supply of homes for sale last February. The graph below lists home sales data by county in Southern California.
Have a Great Weekend! |
Economic Update | Week Ending March 22, 2025