Mortgage Rate Update | January 15, 2026

MRU

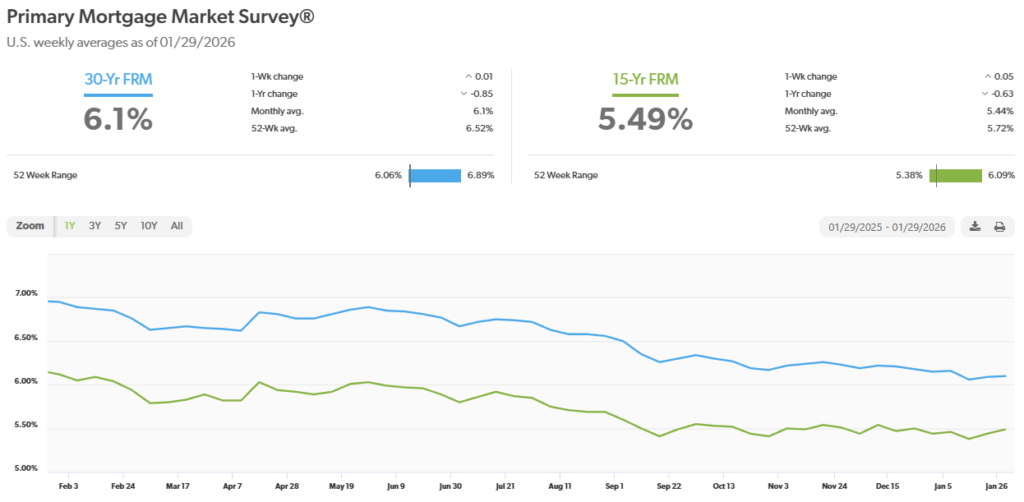
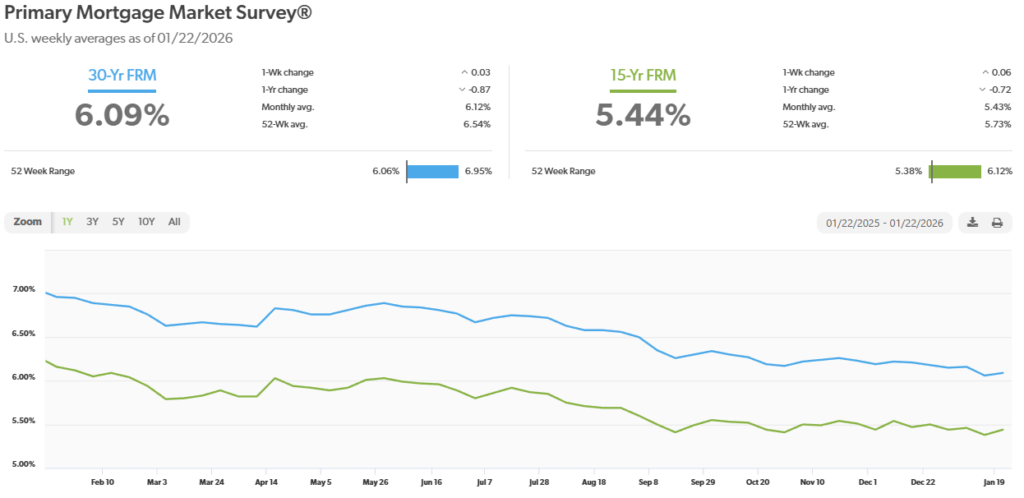
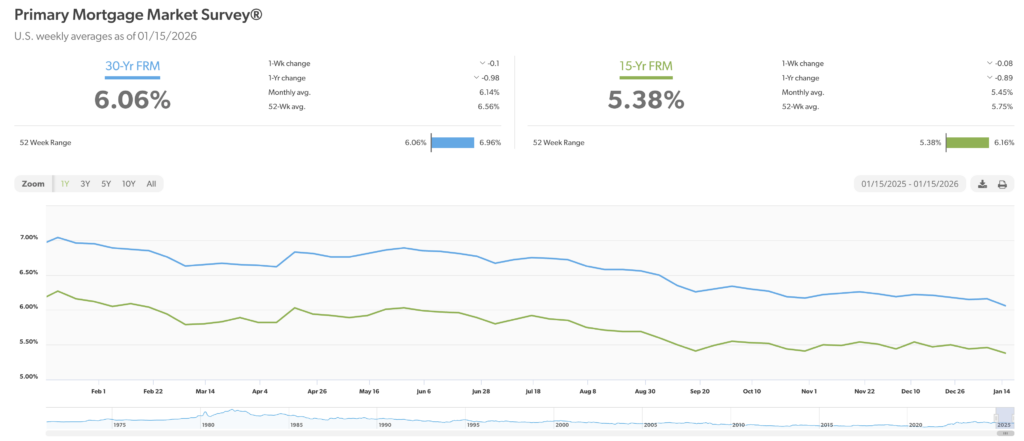
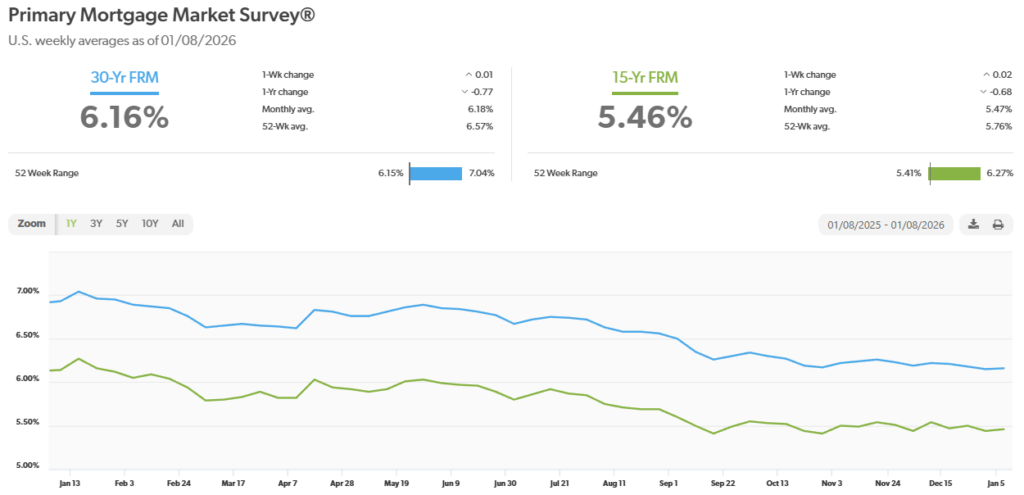
Mortgage rates – Every Thursday, Freddie Mac publishes interest rates based on a survey of mortgage lenders throughout the week. The Freddie Mac Primary Mortgage Survey reported that mortgage rates for the most popular loan products as of January 15, 2026 were as follows:

The 30-year fixed mortgage rate was 6.06%, down from 6.16% last week. The 15-year fixed was 5.38%, down from 5.46% last week.

The graph below shows the trajectory of mortgage rates over the past year.

Economic Update | Week Ending January 10, 2025

Weekly Economic Update; WEU
It was a wild first week of the year. It began with US military action in Venezuela with the promise of returning US oil companies to run oil production, in what is believed to be the largest reserves of oil in the world. Followed by an announcement by President Trump to purchase mortgage securities to drop long-term interest rates, an estimate of fourth-quarter GDP that was off the charts, and a mixed December jobs report. This all caused stocks to surge to record highs.

Housing & Mortgage Rates: President Trump announced a plan directing Fannie Mae and Freddie Mac to purchase $200 billion in mortgage-backed securities, a move aimed at putting downward pressure on mortgage rates and improving affordability. The idea is to help offset the Federal Reserve’s ongoing pullback from the mortgage market and narrow the spread between mortgage rates and Treasury yields. Still, the announcement has been viewed positively by markets as a signal of increased policy support for housing. We saw 30-year mortgage rates drip to under 6% on Friday after Thursday’s announcement, the lowest rate since 2022.

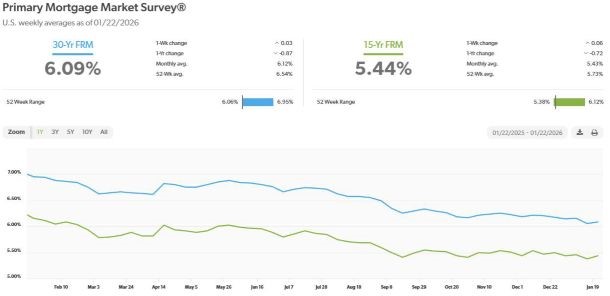
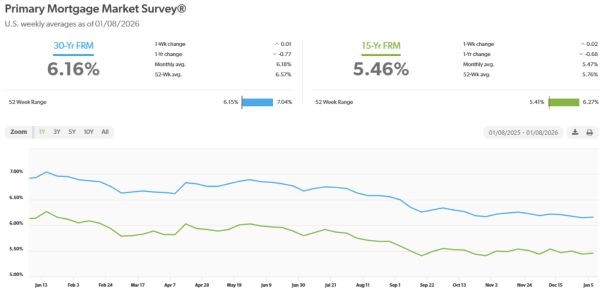
Mortgage rates – Every Thursday, Freddie Mac publishes interest rates based on a survey of mortgage lenders throughout the week. The Freddie Mac Primary Mortgage Survey reported that mortgage rates for the most popular loan products as of January 8, 2026, were as follows: The 30-year fixed mortgage rate was 6.16%, nearly unchanged from 6.15% last week. The 15-year fixed was 5.46%, nearly unchanged from 5.44% last week. If Friday’s rates hold, we will see a big dip in next week’s survey rates.

The graph below shows the trajectory of mortgage rates over the past year.

December Jobs report shows hiring was sluggish while the unemployment rate dipped – Recent labor market data point to a continued moderation in U.S. hiring activity. The Bureau of Labor Statistics reported that 50,000 new jobs were added in December. That was below analyst’s expectations of 70,000. Revisions to the prior two months reduced reported job gains by a combined 76,000. As a result, average monthly job growth for 2025 stands at 49,000, down from 168,000 in 2024, and the three-month average has turned modestly negative. For the year employers added just 584,000 jabs last year, down from 2.2 million new jobs in 2024, marking its worst non-recession year of job growth since 2003. At the same time, the unemployment rate dropped to 4.4% in December, down from a revised 4.5% in November. That is better than economists’ expectations of 4.5% and below the long-term historical average of approximately 5.5%. Despite the slowdown in hiring, average hourly earnings rose 3.8% compared to one year ago.

Estimated 4th quarter U.S. GDP suggest a surge in output – The Federal Reserve Bank of Atlanta’s GDPNow model sharply revised its estimate for U.S. fourth-quarter GDP growth to 5.4% annualized, up from roughly 2.7% just days earlier, driven by an unexpected plunge in the U.S. trade deficit and stronger consumer spending data. This dramatic jump reflects the trade gap narrowing to its lowest level since 2009, turning what had been a drag on growth into a significant contributor. While the GDPNow figure is a real-time nowcast rather than an official BEA release, it signals potentially robust economic momentum as we close out 2025 and reshapes market and policy expectations heading into 2026.

Oil industry news – President Trump announced a US military action in Venezuela capturing and arresting President Nicolas Maduro over narcotic trafficking charges. This laid the groundwork for President Trump to announce that the US had control over Venezuelan oil and that US oil companies, who’s interests and investments in oil production was taken from them in 1976 when then President Carlos Andres Perez nationalized the oil industry, would be returned to US companies. Venezuela has the largest known oil reserves in the world. On Friday Trump hosted oil executives to formulate a plan to encourage investment to US oil companies into Venezuela promising security and cooperation from the Venezuelan government.

The Dow Jones Industrial Average closed the week at 49,504.07 up 2.3% from 48,382.39 last week. It is already up 3% from 48,063.29 on December 31, 2025. The S&P 500 closed the week at 6,966.28, up 1.6% from 6,858.47 last week. The S&P is up 1.8% from 6,845.50 on December 31, 2025. The Nasdaq closed the week at 23,702.88, up 2% from 23,235.63 last week. It is up % from 23,241.99 on December 31, 2025.

The 10-year treasury bond closed the week yielding 4.18%, almost unchanged from 4.19% last week. The 30-year treasury bond yield ended the week at 4.82%, down from 4.86% last week. We watch bond yields because mortgage rates follow bond yields.

Have a Great Weekend!

Mortgage Rate Update | January 8, 2026

MRU

Mortgage rates – Every Thursday, Freddie Mac publishes interest rates based on a survey of mortgage lenders throughout the week. The Freddie Mac Primary Mortgage Survey reported that mortgage rates for the most popular loan products as of January 8, 2026 were as follows:

The 30-year fixed mortgage rate was 6.16%, nearly unchanged from 6.15% last week. The 15-year fixed was 5.46%, nearly unchanged from 5.44% last week.

The graph below shows the trajectory of mortgage rates over the past year.

Rodeo Realty’s 2025 Holiday Party Recap

This year’s Rodeo Realty holiday party was truly one to remember! From great company to festive moments throughout the night, the celebration was a blast from start to finish. In case you missed it—or just want to relive the fun—here are some memorable snapshots from the event. Cheers to a wonderful season and an even brighter year ahead!


Economic Update | Week Ending January 3, 2026 & Year Ending December 31, 2025

Weekly Economic Update; WEU
Stocks surged and Stock markets hit record highs in 2025 – All three indexes hit record highs in 2025 but closed the year slightly off their record highs. AI and robust economic growth fueled the rise in stock prices. The Dow Jones Industrial Average ended the year at 48,063.29, up 13% from 42,544.72 on December 31, 2024. The S&P 500 closed the year at 6,845.50, up 16.4% from 5,881.63 on December 31, 2024. The NASDAQ closed at 23,241.99, up 20.4% from 19,310.79 at the end of 2024. For the week ending January 3, 2026 – The Dow Jones Industrial Average closed the week at 48,382.39 down 0.7% from 48,710.87 last week. The S&P 500 closed the week at 6,858.47, down 1% from 6,929.94 last week. The Nasdaq closed the week at 23,235.63, down 1.5% from 23,593.10 last week.

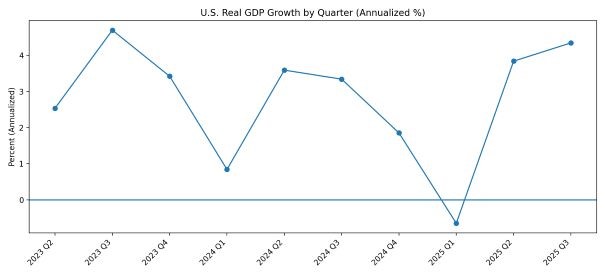
GDP surged in the third quarter of 2025 – The U.S. Gross Domestic Product (GDP), the broadest measure of goods and services in the economy, grew at a staggering 4.3% annualized rate in the third quarter of 2025. Earlier in the year some economists had predicted that the economy was stalling and that a recession could be coming. The pickup in GDP has demonstrated that the economy has remained strong. This was one of the factors that propelled the stock markets this year.

The graph below shows the GDP rate over the past three years
U.S. Treasury Bond Yields – Treasury bond yields ended the year with short term yields lower and long-term about the same as they were at the beginning of the year – The 10-year U.S. treasury bond yield closed the year at 4.18%, down from 4.58% On December 31, 2024. The 30-year treasury yield ended the year at 4.84%, up from 4.78% on Dec. 31, 2024. For the week – The 10-year treasury bond closed the week yielding 4.19%, up from 4.14% last week. The 30-year treasury bond yield ended the week at 4.86%, up from 4.81% last week. We watch bond yields because mortgage rates follow bond yields.

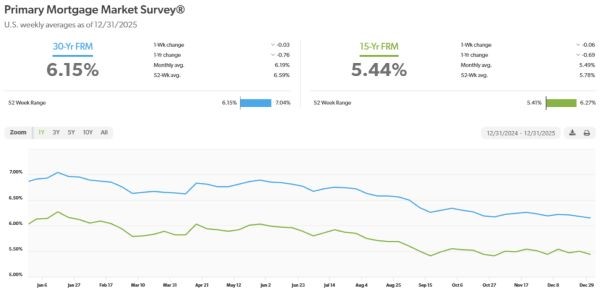
Mortgage rates dropped in 2025 – Experts expect them to drop further in 2026 – The Freddie Mac Primary Mortgage Survey reported that mortgage rates for the most popular loan products as of December 31, 2025, were as follows: The 30-year fixed mortgage rate was 6.15%, down from 6.85% on December 26, 2024. The 15-year fixed was 5.44%, down from 6% on December 26, 2024.

The graph below shows the trajectory of mortgage rates over the past year.
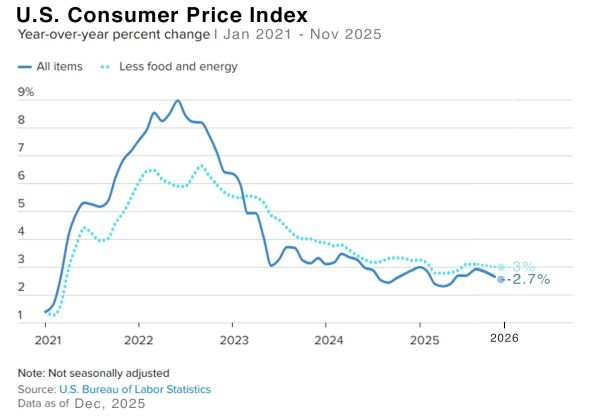
Inflation – We watch inflation because mortgage interest rates are tied to inflation. The higher the inflation rate, the higher mortgage rates are. As inflation cools, mortgage rates drop. While we look at many different inflation reports, we have less data this year than we normally have because key indexes have not been released due to the government shutdown. One report, the Consumer Price Index (CPI) for November was released. It showed that consumer prices rose 2.7% from one year ago in November. While still far from the Fed’s 2% annual target it was much lower than the 3.1% that economists polled expected. The CPI rate peaked at 9.1% in June 2022 and worked its way down to 2.3% in April. Unfortunately, the CPI rate began to increase from there and peaked at 3% in September, which economists attribute to tariff costs being passed on to consumers, before dropping to 2.7% in November. The core CPI rate, which excludes volatile food and energy prices rose 2.6% from one year ago, also below economists’ expectations. This gave hope to investors that inflation may be cooling enough for the Fed to continue to lower rates. The Fed’s favorite measures of inflation is the Personal Consumption Expenditure Index (PCE). Unfortunately, due to the shutdown, the October and November numbers are still being tabulated and are scheduled for release with the December figures at the end of January. For September, it showed that headline PCE rose 0.3% in September from August. That was in-line with economists’ expectations. On an annual basis PCE rose 2.7% from one year earlier, below the 2.8% expected. Core PCE, which does not include food and energy prices because those tend to be more volatile, increased 0.2% month-over-month in September. On an annual basis it was up 2.8% from one year earlier. That was below the 2.9% economists expected.
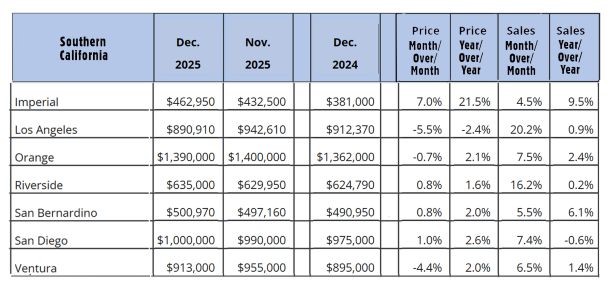
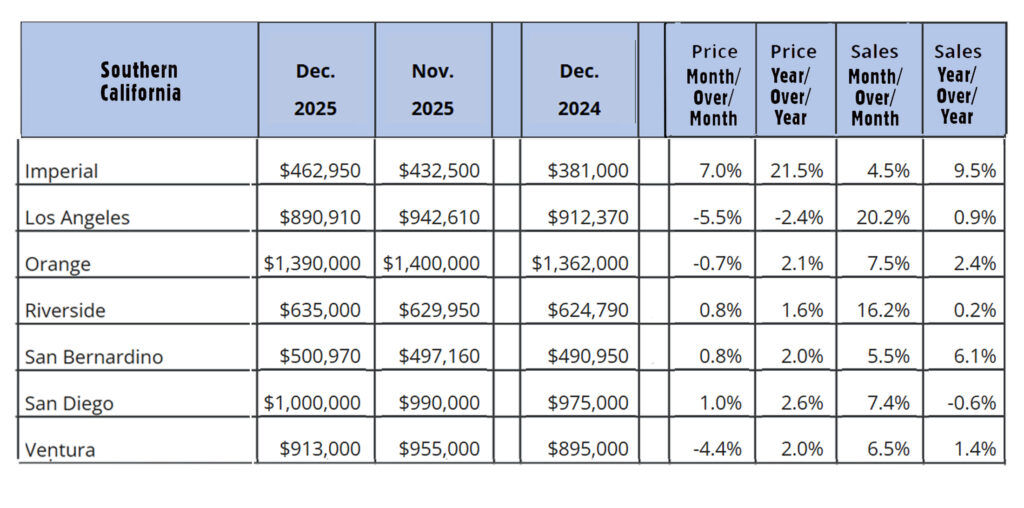
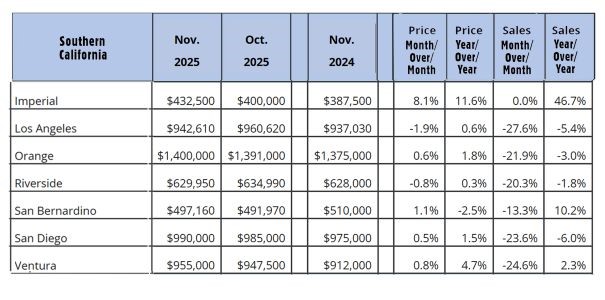
November home sales – The California Association of Realtors and the National Association of Real Estate release home sales data on the third week of each month for the previous month. Here is the November 2025 home sales recap. You can run a report on your city or zip code with the same data at RodeoRe.com

U.S. existing-home sales – November 2025 – The National Association of Realtors reported that existing-home sales totaled 4.13 million units on a seasonally adjusted annualized rate in November, up 0.5% from the number of homes sold in October and down 1% from the number of homes sold last November. The median price paid for a home sold in the U.S. in November was $409,200, down from $415,200 in October, but up 1.2% from $404,400 one year ago. There was a 4.2-month supply of homes for sale in November, up from a 3.8-month supply last November. First-time buyers accounted for 30% of all sales, up from 30% last month. Investors and second-home purchases accounted for 18% of all sales, down from 15% in August. All cash purchases accounted for 27% of all sales, up from 30% last month. Foreclosures and short sales accounted for 2% of all sales.

California existing-home sales – The California Association of Realtors reported that existing-home sales totaled 287,940 on an annualized basis in November, up 1.9% from 285,590 in October. Year-over-year sales were up 2.6% from a revised 280,530 annualized home sales last November. The statewide median price paid for a home in was $852,680 in November, down 3.9% from 886,960 in October. Year-over-year the median price was almost unchanged from $852,880 last November. The unsold inventory index showed that there was a 3.1-month supply of homes for sale in October. These numbers ae a little deceiving. Prices have dropped more than the median price indicates. The median price is the mid-point of all homes sold. Basically, it’s the point where one half of the homes sold for more and one half of the homes sold for less. Usually, the median price is a good indicator of prices across the board. There are times when conditions impact that. This is one of those times. With stock market values at all-time highs, which they were in October, people invested in the stock market are flusher than people that are not. Additionally, many of the factors that impact people’s ability and desire to buy a home affect people more in the lower income range than they affect people in higher income ranges. That’s happening now. Sales are down in all price ranges compared to any time prior to interest rates rising in mid-2022, but sales in the lower price ranges as a percentage of all sales are fewer than we would normally see as those people are more impacted by inflation, don’t have stocks, etc.

The graph below shows CAR sales data by county for Southern California.
Have a Great Weekend!

Economic Update | Month Ending December 31, 2025

Stocks surged and Stock markets hit record highs in 2025 – All three indexes hit record highs in 2025 but closed the year slightly off their record highs. AI and robust economic growth fueled the rise in stock prices. The Dow Jones Industrial Average ended the year at 48,063.29, up 13% from 42,544.72 on December 31, 2024. The S&P 500 closed the year at 6,845.50, up 16.4% from 5,881.63 on December 31, 2024. The NASDAQ closed at 23,241.99, up 20.4% from 19,310.79 at the end of 2024. GDP surged in the third quarter of 2025 – The U.S. Gross Domestic Product (GDP), the broadest measure of goods and services in the economy, grew at a staggering 4.3% annualized rate in the third quarter of 2025. Earlier in the year, some economists had predicted that the economy was stalling and that a recession could be coming. The pickup in GDP has demonstrated that the economy has remained strong. This was one of the factors that propelled the stock markets this year.

The graph below shows the GDP rate over the past three years

U.S. Treasury Bond Yields – Treasury bond yields ended the year with short-term yields lower and long-term about the same as they were at the beginning of the year – The 10-year U.S. Treasury bond yield closed the year at 4.18%, down from 4.58% on December 31, 2024. The 30-year treasury yield ended the year at 4.84%, up from 4.78% on Dec. 31, 2024. We watch bond yields because mortgage rates often follow Treasury bond yields.

Mortgage rates dropped in 2025 – Experts expect them to drop further in 2026 –The Freddie Mac Primary Mortgage Survey reported that mortgage rates for the most popular loan products as of December 31, 2025, were as follows: The 30-year fixed mortgage rate was 6.15%, down from 6.85% on December 26, 2024. The 15-year fixed was 5.44%, down from 6% on December 26, 2024.

The graph below shows the trajectory of mortgage rates over the past year.

Inflation – We watch inflation because mortgage interest rates are tied to inflation. The higher the inflation rate, the higher the mortgage rates are. As inflation cools, mortgage rates drop. While we look at many different inflation reports, we have less data this year than we normally have because key indexes have not been released due to the government shutdown. One report, the Consumer Price Index (CPI) for November, was released. It showed that consumer prices rose 2.7% from one year ago in November. While still far from the Fed’s 2% annual target, it was much lower than the 3.1% that economists polled expected. The CPI rate peaked at 9.1% in June 2022 and worked its way down to 2.3% in April. Unfortunately, the CPI rate began to increase from there and peaked at 3% in September, which economists attribute to tariff costs being passed on to consumers, before dropping to 2.7% in November. The core CPI rate, which excludes volatile food and energy prices, rose 2.6% from one year ago, also below economists’ expectations. This gave hope to investors that inflation may be cooling enough for the Fed to continue to lower rates. The Fed’s favorite measure of inflation is the Personal Consumption Expenditure Index (PCE).Unfortunately, due to the shutdown, the October and November numbers are still being tabulated and are scheduled for release with the December figures at the end of January. For September, it showed that headline PCE rose 0.3% in September from August. That was in line with economists’ expectations. On an annual basis, PCE rose 2.7% from one year earlier, below the 2.8% expected. Core PCE, which does not include food and energy prices because those tend to be more volatile, increased 0.2% month-over-month in September. On an annual basis, it was up 2.8% from one year earlier. That was below the 2.9% economists expected.

November home sales – The California Association of Realtors and the National Association of Realtors release home sales data on the third week of each month for the previous month. Here is the November 2025 home sales recap. You can run a report on your city or zip code with the same data at RodeoRe.com

U.S. existing-home sales – November 2025 – The National Association of Realtorsreported that existing-home sales totaled 4.13 million units on a seasonally adjusted annualized rate in November, up 0.5% from the number of homes sold in October and down 1% from the number of homes sold last November. The median price paid for a home sold in the U.S. in November was $409,200, down from $415,200 in October, but up 1.2% from $404,400 one year ago. There was a 4.2-month supply of homes for sale in November, up from a 3.8-month supply last November. First-time buyers accounted for 30% of all sales, up from 30% last month. Investors and second-home purchases accounted for 18% of all sales, down from 15% in August. All cashpurchases accounted for 27% of all sales, up from 30% last month. Foreclosures and short sales accounted for 2% of all sales.

California existing-home sales – The California Association of Realtors reported that existing-home sales totaled 287,940 on an annualized basis in November, up 1.9% from 285,590 in October. Year-over-year sales were up 2.6% from a revised 280,530 annualized home sales last November. The statewide median price paid for a home was $852,680 in November, down 3.9% from 886,960 in October. Year-over-year, the median price was almost unchanged from $852,880 last November. The unsold inventory index showed that there was a 3.1-month supply of homes for sale in October. These numbers are a little deceiving. Prices have dropped more than the median price indicates. The median price is the mid-point of all homes sold. Basically, it’s the point where one half of the homes sold for more and one half of the homes sold for less. Usually, the median price is a good indicator of prices across the board. There are times when conditions impact that. This is one of those times. With stock market values at all-time highs, which they were in October, people who invested in the stock market are flusher than people who are not. Additionally, many of the factors that impact people’s ability and desire to buy a home affect people more in the lower income range than they affect people in higher income ranges. That’s happening now. Sales are down in all price ranges compared to any time prior to interest rates rising in mid-2022, but sales in the lower price ranges as a percentage of all sales are fewer than we would normally see, as those people are more impacted by inflation, don’t have stocks, etc.

The graph below shows CAR sales data by county for Southern California.

Mortgage Rate Update | December 31, 2025

MRU

Mortgage rates – Every Thursday, Freddie Mac publishes interest rates based on a survey of mortgage lenders throughout the week. The Freddie Mac Primary Mortgage Survey reported that mortgage rates for the most popular loan products as of December 31, 2025 were as follows:

The 30-year fixed mortgage rate was 6.15%, down slightly from 6.18% last week. The 15-year fixed was 5.44%, down from 5.5% last week.

The graph below shows the trajectory of mortgage rates over the past year.

Mortgage Rate Update | December 24, 2025

MRU

Mortgage rates – Every Thursday, Freddie Mac publishes interest rates based on a survey of mortgage lenders throughout the week. The Freddie Mac Primary Mortgage Survey reported that mortgage rates for the most popular loan products as of December 24, 2025 were as follows:

The 30-year fixed mortgage rate was 6.18%, down slightly from 6.21% last week. The 15-year fixed was 5.5%, up slightly from 5.47% last week.

The graph below shows the trajectory of mortgage rates over the past year.

Economic Update | Ending December 20, 2025

Weekly Economic Update; WEU

Inflation cooled in November – On Thursday the government released the Consumer Price Index (CPI) for November. It showed that consumer prices rose 2.7% from one year ago in November. While still far from the Fed’s 2% annual target it was much lower that the 3.1% that economists polled expected. The core CPI rate, which excludes volatile food and energy prices rose 2.6% from one year ago, also below economists’ expectations. This gave hope to investors that inflation may be cooling enough for the Fed to continue to lower rates.

November jobs report shows some weakness in the labor market – The Bureau of Labor and Statistics released the November jobs report on Wednesday. Usually, jobs reports are released on the first Friday of each month, but the October and November reports were delayed until Wednesday due to the government shutdown that ended in November. It showed that U.S. employers added just 64,000 jobs in November and that 105,000 jobs were lost in October. The unemployment rate increased to 4.6% in November, up from 4.4% in September, its highest level in four years.

Stock Markets – The Dow Jones Industrial Average closed the week at 48,134.89, down 0.7% from 48,458.05 last week. Year-to-date, it is up 8.1% from 44,544.66 on December 31, 2024. The S&P 500 closed the week at 6,834.50, up 0.1% from 6,827.41 last week. Year-to-date, the S&P is up 13.1% from 6,040.53 on December 31, 2024. The Nasdaq closed the week at 23,303.62, up 0.5% from 23,195.17 last week. Year-to-date, it is up 18.7% from 19,627.44 on December 31, 2024.

U.S. Treasury bond yields – The 10-year treasury bond closed the week yielding 4.16%, down slightly from 4.19% last week. The 30-year treasury bond yield ended the week at 4.82%, down slightly from 4.85% last week. We watch bond yields because mortgage rates follow bond yields.

Mortgage rates – Every Thursday, Freddie Mac publishes interest rates based on a survey of mortgage lenders throughout the week. The Freddie Mac Primary Mortgage Survey reported that mortgage rates for the most popular loan products as of December 18, 2025, were as follows: The 30-year fixed mortgage rate was 6.21%, nearly unchanged from 6.22% last week. The 15-year fixed was 5.47%, down from 5.54% last week. The graph below shows the trajectory of mortgage rates over the past year.

The graph below shows the trajectory of mortgage rates over the past year.

Image

November home sales – The California Association of Realtors and the National Association of Real Estate release home sales data on the third week of each month for the previous month. Here is the November 2025 home sales recap. You can run a report on your city or zip code with the same data at RodeoRe.com

U.S. existing-home sales – November 2025 – The National Association of Realtors reported that existing-home sales totaled 4.13 million units on a seasonally adjusted annualized rate in November, up 0.5% from the number of homes sold in October and down 1% from the number of homes sold last November. The median price paid for a home sold in the U.S. in November was $409,200, down from $415,200 in October, but up 1.2% from $404,400 one year ago. There was a 4.2-month supply of homes for sale in November, up from a 3.8-month supply last November. First-time buyers accounted for 30% of all sales, up from 30% last month. Investors and second-home purchases accounted for 18%of all sales, down from 15% in August. All cash purchases accounted for 27% of all sales, up from 30% last month. Foreclosures and short sales accounted for 2% of all sales

California existing-home sales – The California Association of Realtors reported that existing-home sales totaled 287,940 on an annualized basis in November, up 1.9% from 285,590 in October. Year-over-year sales were up 2.6% from a revised 280,530 annualized home sales last November. The statewide median price paid for a home in was $852,680 in November, down 3.9% from 886,960 in October. Year-over-year the median price was almost unchanged from $852,880 last November. The unsold inventory index showed that there was a 3.1-month supply of homes for sale in October. These numbers ae a little deceiving. Prices have dropped more than the median price indicates. The median price is the mid-point of all homes sold. Basically, it’s the point where one half of the homes sold for more and one half of the homes sold for less. Usually, the median price is a good indicator of prices across the board. There are times when conditions impact that. This is one of those times. With stock market values at all-time highs, which they were in October, people invested in the stock market are flusher than people that are not. Additionally, many of the factors that impact people’s ability and desire to buy a home affect people more in the lower income range than they affect people in higher income ranges. That’s happening now. Sales are down in all price ranges compared to any time prior to interest rates rising in mid-2022, but sales in the lower price ranges as a percentage of all sales are fewer than we would normally see as those people are more impacted by inflation, don’t have stocks, etc.

The graph below shows CAR sales data by county for Southern California.

Image

Have a Great Weekend!

Mortgage Rate Update | December 18, 2025

MRU

Mortgage rates – Every Thursday, Freddie Mac publishes interest rates based on a survey of mortgage lenders throughout the week. The Freddie Mac Primary Mortgage Survey reported that mortgage rates for the most popular loan products as of December 18, 2025 were as follows:

The 30-year fixed mortgage rate was 6.21%, nearly unchanged from 6.22% last week. The 15-year fixed was 5.47%, down from 5.54% last week.

The graph below shows the trajectory of mortgage rates over the past year.