|
Stock market indexes ended the year at record highs – To call 2020 a year for Wall Street would be an understatement! The year started off with the lowest unemployment rate in 50 years and stock markets hitting record-high levels, but by March a once-in-a-century pandemic hit. As cases began to surge and hospitals become overwhelmed by a new virus that they had no experience in treating, state and local governments began issuing stay-at-home orders. That essentially shut down the U.S. economy. The virus was named COVID-19. As the economy shut down millions of workers were laid off. Within six weeks the unemployment rate went from a 50-year low of 3.5% to 14.7%, the highest rate since the Great Depression. Stock markets dropped 30% in one month. At the end of March, the federal government stepped in with the CARES Act that added $2.2 trillion in economic stimulus to the economy. The Federal Reserve dropped its key overnight rate to 0% and quickly began adding liquidity to the economy. Stocks rebounded and by August were once again reaching record highs. Retail sales also rebounded to pre-pandemic levels, and the real estate market surged, assisted by record-low mortgage rates. Price gains and housing sales numbers hit double-digit gains. In the final week of the year, two vaccines for COVID-19 had been approved for use, another $900 billion stimulus plan was signed into law that will be distributed in the first quarter of 2021, and all stock market indexes hit record highs. We enter 2021 with stocks at record highs, retail sales strong and the real estate market surging at historic levels. Unfortunately, at the same time, new COVID-19 cases are spiking, our hospitals are overwhelmed, healthcare workers are reaching a breaking point, unemployment remains high, and many people are suffering, which makes it difficult to explain the robust economic data and home sales. The Dow Jones Industrial Average ended the year at 30,606.48, up 7.2% from 28,538.44 at the close of 2019. The S&P 500 closed the year at 3,756.07, up 16.3% from 3,230.78 at the end of 2019. The NASDAQ closed at 12,888.28, up 43.6% from 8,972.60 on December 31, 2019.
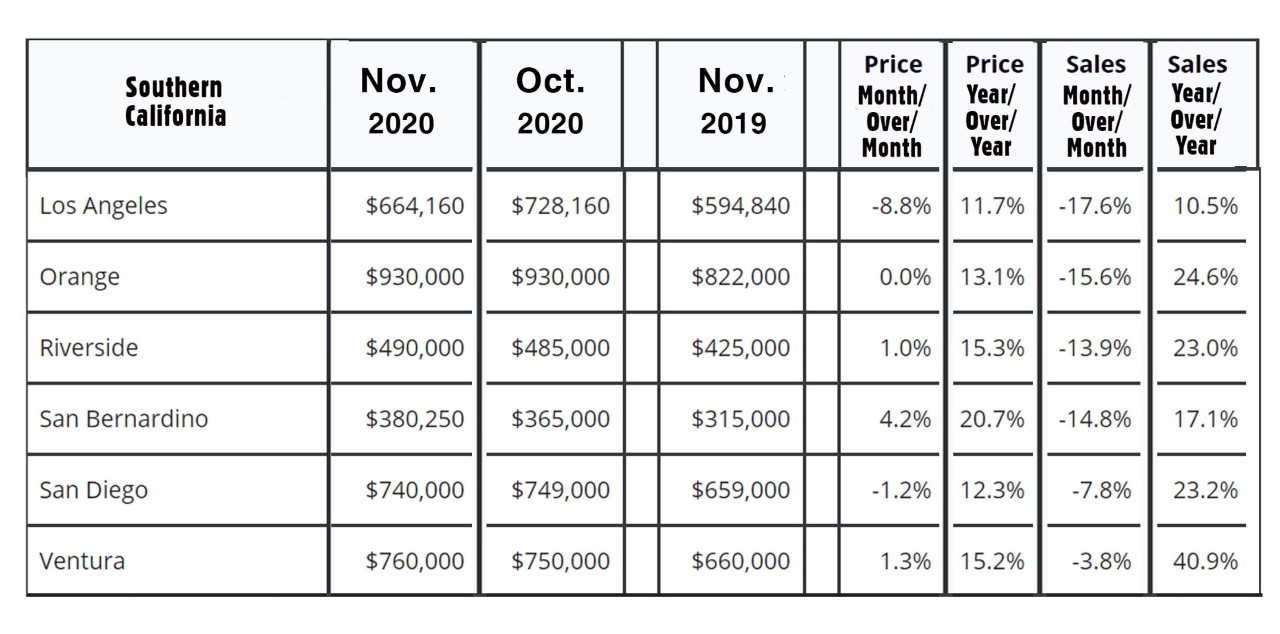
U.S. Unemployment – The Bureau of Labor Statistics reported that the unemployment rate in November2020 was 6.7%, up from a 3.5%, a 50-year low, in December 2019. The country suffered massive layoffs after the pandemic began in March. The unemployment rate peaked in April at 14.7%, the highest rate since the Great Depression. April marked a 10.3% increase in the unemployment rate, the largest monthly increase in history. Fortunately, the unemployment rate has steadily worked its way down. It was 6.7% in November and experts expect it will be a similar rate in December. Those figures will be released Friday, January 8, 2021. U.S. Treasury Bond Yields dropped sharply in 2020 – The 10-year U.S. treasury bond yield closed the year at 0.93%, down from 1.92% On December 31, 2019. The 30-year treasury yield ended the year at 1.65%, down from 2.30% on Dec. 31, 2019. We watch bond yields because mortgage rates follow treasury bonds Mortgage Rates dropped to historic lows in 2020 – The December 31, 2020, Freddie Mac Primary Mortgage Survey reported that the 30-year fixed-rate mortgage average was 2.67%, down from 3.72% on December 28, 2018. The 15-year fixed was 2.17%, down from 3.16% last December. The 5-year ARM was 2.71%, down from 3.46% at the close of 2019. Home sales data is reported on the third week of each month for the previous month. These are November’s results. U.S. existing home sales – The National Association of Realtors reported that existing home sales totaled 6.69 million on a seasonally-adjusted annualized rate. Year-over-year that marked a 25.8% increase over the 5.32 million units sold on a seasonally-adjusted annualized rate in November 2019. The median price also increased to 14.6% year-over-year to $310,800 from $271,300 last November. That marked the 105th straight month of year-over-year increases in the median price. The median price figure includes all housing types: single-family, condominiums, townhomes, and co-ops. Unsold housing inventory sits at an all-time low of a 2.3-month supply, down from a 2.5-month supply one year ago. California existing home sales – The California Association of Realtors reported that existing, single-family home sales totaled 508,820 on an annualized basis in November. That represented a year-over-year increase of 26.3% from the number of homes sold in November 2019 when single-family home sales totaled 402,880 on an annualized basis. It was the first time that monthly home sales exceeded 500,000 units on an annualized basis in 11 years, and the most homes ever sold in November. Home sales are homes that closed escrow. Pending home sales are new contracts signed. Those are at near-record levels as well. The median price paid for a home in California was $699,000, up 18.5% from the median price last November. Inventory levels were lower than one year ago. There was just a 1.9-month supply of homes for sale in November, down from a 3.1-month supply one year ago. The current supply of homes was almost unchanged from September and October, as a record number of new listings were taken in November but sold quickly. Below please find a graph of regional statistics for Southern California. |