|
Stock markets – The Dow Jones Industrial Average closed the month at 30,932.37, up 3.2% from29,982.62 at the end of January. It is up 1.1% year-to-date. The S&P 500 closed the month at 3,811.15, up 2.6% from 3,714.24 last month. It is up 1.6% year-to-date. The NASDAQ closed the month at 13,192.35, up 1% from 13,079.69 last month It is up 2.3% year-to-date.
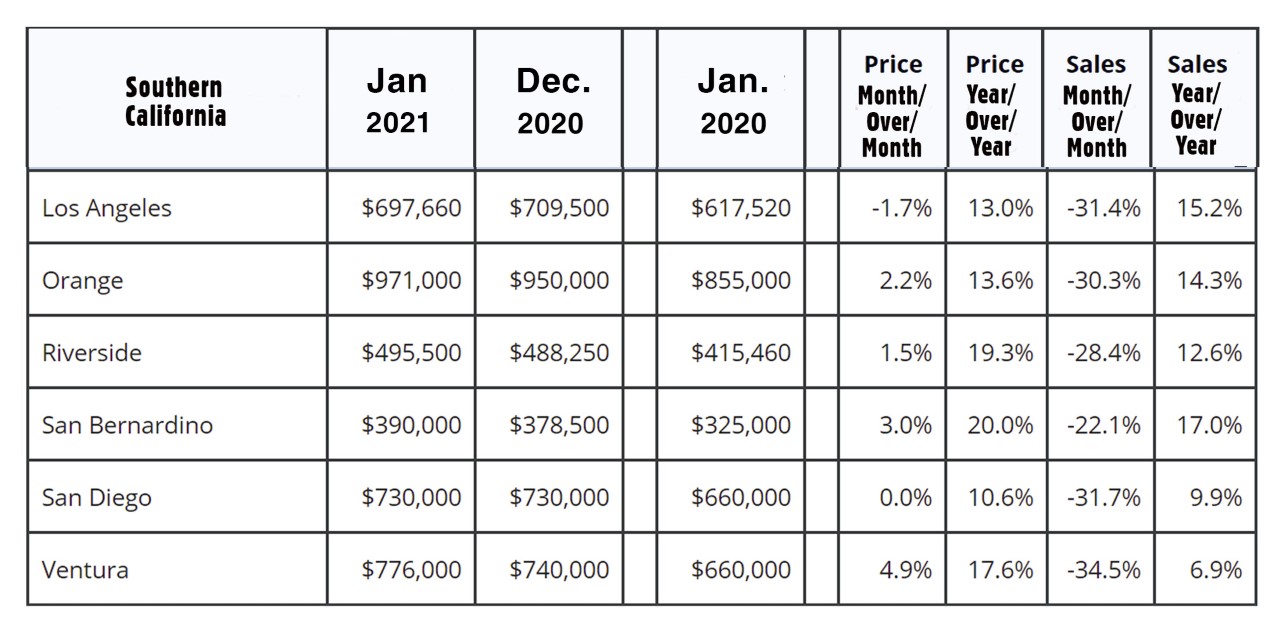
U.S. Treasury bond yields – The 10-year treasury bond closed the month yielding 1.44%, up from 1.11% last month. The 30-year treasury bond yield ended the month at 2.17, up from 1.87% last month. We watch bond yields because mortgage rates often follow treasury bond yields. Mortgage rates – The February 25, 2021, Freddie Mac Primary Mortgage Survey reported mortgage rates for the most popular loan products as follows: The 30-year fixed mortgage rate was 2.97%, up from 2.73% last month. The 15-year fixed was 2.34%, up from 2.20% last month. The 5-year ARM was 2.99%, up from 2.80% last month. U.S. employers added 49,000 jobs in January – The Department of Labor and Statics reported that 49,000 net new jobs were added in January. That’s a dramatic turnaround from December when the economy lost 227,000 jobs. February figures will be released on Friday. Job gains are expected to be significantly higher, as a rapid drop in COVID cases has prompted more of the economy to re-open allowing employers to re-hire workers. The unemployment rate in January was 6.3, down from 6.7% in December. Housing data is released in the third week of the month for the previous month. These are January’s sales figures. We expect February closings to exhibit strong year-over-year figures as well. You will be able to get a real estate market report for your city or zip code on my website on February 8, 2021. U.S. existing single-family home sales – The National Association of Realtors reported that existing-home sales increased to a seasonally-adjusted annualized rate of 6.69 million units. That’s an increase of 0.6% from the number of homes sold in December, and a 23.7% increase from the number of homes sold last January. The median price paid for a home in the U.S. in January was $303,900, up 14.1% from January 2020 when the median price was $266,300. There was just a 1.9-month supply of homes for sale compared to a 3.1-month supply one year ago. California existing home sales – The California Association of Realtors reported that existing, single-family home sales totaled 484,730 on an annualized basis in January. That represented a year-over-year increase of 22.5% from the 395,700 annualized rate of homes sold in January 2020. The median price paid for a home in California was $699,890, up 21.7% from the median price of $575,160 last January. Inventory levels were lower than one year ago. There was just a 1.5-month supply of homes for sale in January, down from a 3.4-month supply one year ago. Below please find a graph of regional statistics for Southern California. |