|
Stock markets – The Dow Jones Industrial Average closed the month at 33,066.96, up 6.9% from 30,932.37 at the end of January. It is up 8.0% year-to-date. The S&P 500 closed the month at 3,958.55, up 3.9% from 3,811.15 last month. It is up 5.6% year-to-date. The NASDAQ closed the month at 13,045.29, down 1.2%from 13,192.35 last month It is up 1.9% year-to-date.
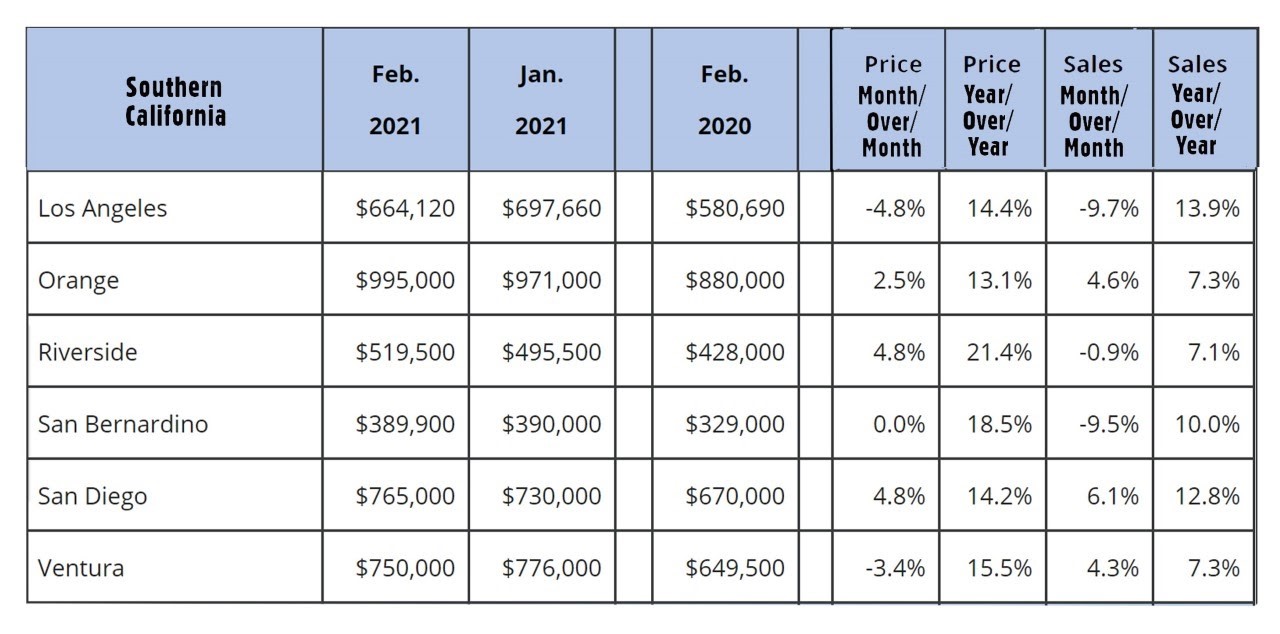
U.S. Treasury bond yields – The 10-year treasury bond closed the month yielding 1.74%, up from 1.44% last month. The 30-year treasury bond yield ended the month at 2.41, up from 2.17% last month. We watch bond yields because mortgage rates often follow treasury bond yields. Mortgage rates – The April 01, 2021, Freddie Mac Primary Mortgage Survey reported mortgage rates for the most popular loan products as follows: The 30-year fixed mortgage rate was 3.18%, up from 2.97% last month. The 15-year fixed was 2.45%, up from 2.34% last month. The 5-year ARM was 2.84%, down from 2.99% last month. U.S. employers added 379,000 jobs in February – The Department of Labor and Statics reported that 379,000 net new jobs were added in January. That’s a healthy turnaround from January when the economy gained just 49,000 jobs. The figure also stunned analysts who expected 210,000 new jobs due to a rapid drop in COVID cases that has allowed more of the economy to re-open. Most of the gains came from the hospitality and leisure sector which saw an increase of 355,000 jobs as employers re-hired workers upon re-opening. Of those 355,000 hospitality and leisure workers, 286,000 work in bars and restaurants, 36,000 in hotels, and 33,000 in gambling and recreation businesses. Despite the gains, the hospitality and leisure sector still has 3.5 million fewer workers than before the pandemic. The unemployment rate in February was 6.2%, down from 6.3% in January. The March jobs report will be released tomorrow and included in the report this weekend. Home sales statistics are compiled and reported around the third week of the month for the previous month. These are February’s results. U.S. existing-home sales -The National Association of Realtors announced that the number of existing-home sales in February was 6.22 million on a seasonally-adjusted annualized rate. That marked a drop of 6.6% from January’s sales rate, but a 9.1% increase from February 2020, when sales totaled 5.70 million on a seasonally-adjusted annualized basis. One reason is that February has three fewer days (10% fewer days) than January and that the majority of February closings went under contract in December and January which has fewer openings due to the holidays. The median existing-home sales price in February was 15.8% higher than one year ago. That marked 108 straight months of year-over-year increases in the median price. Existing-home sales include all single-family, condominium, townhouse, and co-op sales. California existing home sales – The California Association of Realtors reported that existing, single-family home sales totaled 462,720 on an annualized basis in February. That represented a year-over-year increase of 9.7% from the 421,670 annualized rate of homes sold in January 2020. The median price paid for a home in California was $699,000, up 20.6% from the median price of $579,770 last February. Inventory levels were lower than one year ago. There was just a 2.0-month supply of homes for sale in February, down from a 3.6-month supply one year ago. Below please find a graph of regional statistics for Southern California. |