Stock markets dropped again this week – The Dow suffered its eighth consecutive weekly loss which marks its longest weekly losing streak since 1923. The S&P and Nasdaq suffered their seventh weekly loss, their longest losing streak since 2001. It is a strange time.
First-quarter corporate profits were much stronger than expected, and the economy and job market are showing very strong numbers; however, investors fear that inflation, higher interest rates, war, supply chain shortages, and a China lockdown will soon lead to a drop in profits, and possibly a recession. The Dow Jones Industrial Average closed the week at 31,261.90, down 2.1% from 32,196.66 last week. It is down 11.4% year-to-date. The S&P 500 closed the week at 3,901.36, down 2.4% from 4,023.89 last week. The S&P is down 15.6% year-to-date. The NASDAQ closed the week at 11,354.62, down 2.8% from 11,805.00 last week. It is down 24.5% year-to-date.
U.S. Treasury bond yields – The 10-year treasury bond closed the week yielding 2.78%, down from 2.93% last week. The 30-year treasury bond yield ended the week at 2.99%, down from 3.10% last week. We watch bond yields because mortgage rates often follow treasury bond yields.
Mortgage rates – Home mortgage rates appear to be stabilizing. The Freddie Mac Primary Mortgage Survey reported that mortgage rates as of May 19, 2022 for the most popular loan products were as follows: The 30-year fixed mortgage rate was 5.25%, down from 5.30% last week. The 15-year fixed was 4.43%, down from 4.48% last week. The 5-year ARM was 4.08%, up from 3.98% last week.
U.S. existing-home sales – The National Association of Realtors reported that existing-home sales totaled 5.61 million units on a seasonally adjusted annualized rate in April, down 2.4% month-over-month from the annualized number of sales in March. Year-over-year sales were down 5.9% from the annualized rate of 5.96 million in April 2021. The median price of a home in the U.S. in April was $391,200, up 14.8% from $340,700 one year ago. April marked a record 122 consecutive months of year-over-year increases in the median price. Inventory levels ticked up slightly from March but remained near record lows. There was a 2.2-month supply of homes for sale in April, down from a 2.3 month supply one year ago. First-time buyers accounted for 28% of all sales. Investors and second-home purchases accounted for 17% of all sales. All-cash purchases accounted for 26% of all sales. Foreclosure and short-sales accounted for less than 1% of all sales remaining at a historic low.
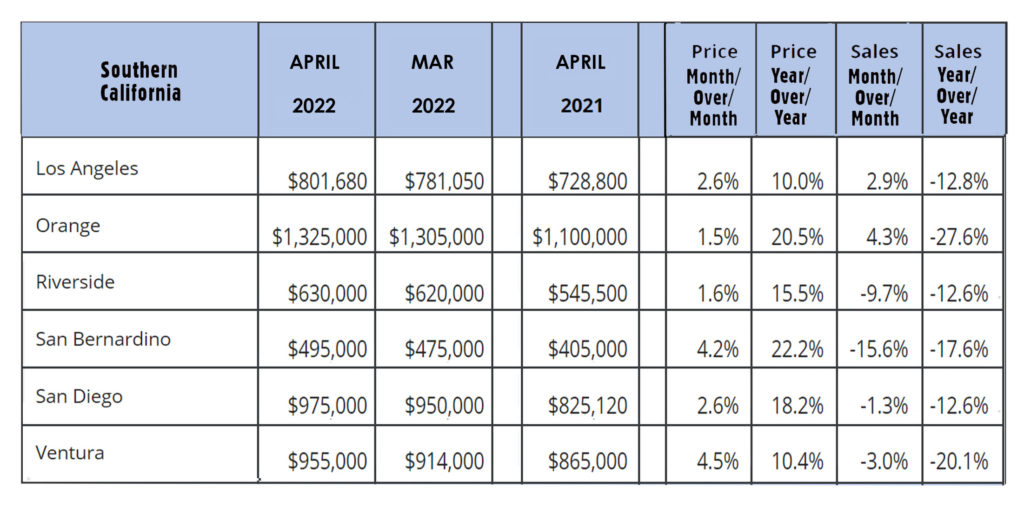
California existing-home sales – Lower inventory has led to a drop in the number of sales and a rise in prices – The California Association of Realtors reported that existing-home sales totaled 419,040 on a seasonally adjusted annualized rate in April, which marked an 8.5% year-over-year drop from the number of homes sold in April 2021. Existing-home sales in the first quarter of 2022 are down 7.0% from the number of homes sold in the first quarter of 2021, which pretty closely matches the drop in the number of new listings. The median price paid for a home in March was $884,890, up 4.2% from March’s 2021 median price of $849,080. Year-over-year prices are up 8.5%. There was a 1.8-month supply of homes for sale in April, up slightly from a 1.6-month supply of homes in April 2021.
The graph below shows regional figures by county in Southern California.